
DeltaNova PowerPoint Comparison
DeltaNova PowerPoint Compare compares Microsoft PowerPoint presentations with the .pptx file extension.
DeltaNova PowerPoint Compare takes two Microsoft PowerPoint files, compares the content, and provides a valid .pptx output containing the review comments showing the differences between the two input documents, alongside a HTML summary report.
Benefits
-
DeltaNova PowerPoint Compare automates change detection between two Microsoft PowerPoint files and presents the changes in a structured format. You can view the changes either inside Microsoft PowerPoint through comments, or through a companion HTML report.
-
The output provides a comparison review workflow for Microsoft PowerPoint presentations, which Microsoft PowerPoint no longer provides natively.
-
DeltaNova PowerPoint Compare produces a valid Microsoft PowerPoint presentation result based on the B input, including comments to facilitate further editing and reporting.
DeltaNova PowerPoint Compare identifies and represents differences across the main structural and visual components of a Microsoft PowerPoint presentation. The comparison focuses on changes that affect slide content, layout, ordering, and visible presentation elements.
How DeltaNova PowerPoint Compare Represents Changes
DeltaNova PowerPoint Compare shows detected changes in both a result Microsoft PowerPoint file and an HTML summary report. Understanding this representation strategy helps you interpret and navigate your comparison result.
The comparison considers the B Input as the latest file, therefore the Microsoft PowerPoint result output and the report representation are in relation to the B input. Content deleted from A to B are represented as floating comments applied to the B input document.
Microsoft PowerPoint Result
Differences are shown within the Microsoft PowerPoint result file using Microsoft PowerPoint review comments. This enables you to see, review, and make changes directly inside the presentation.
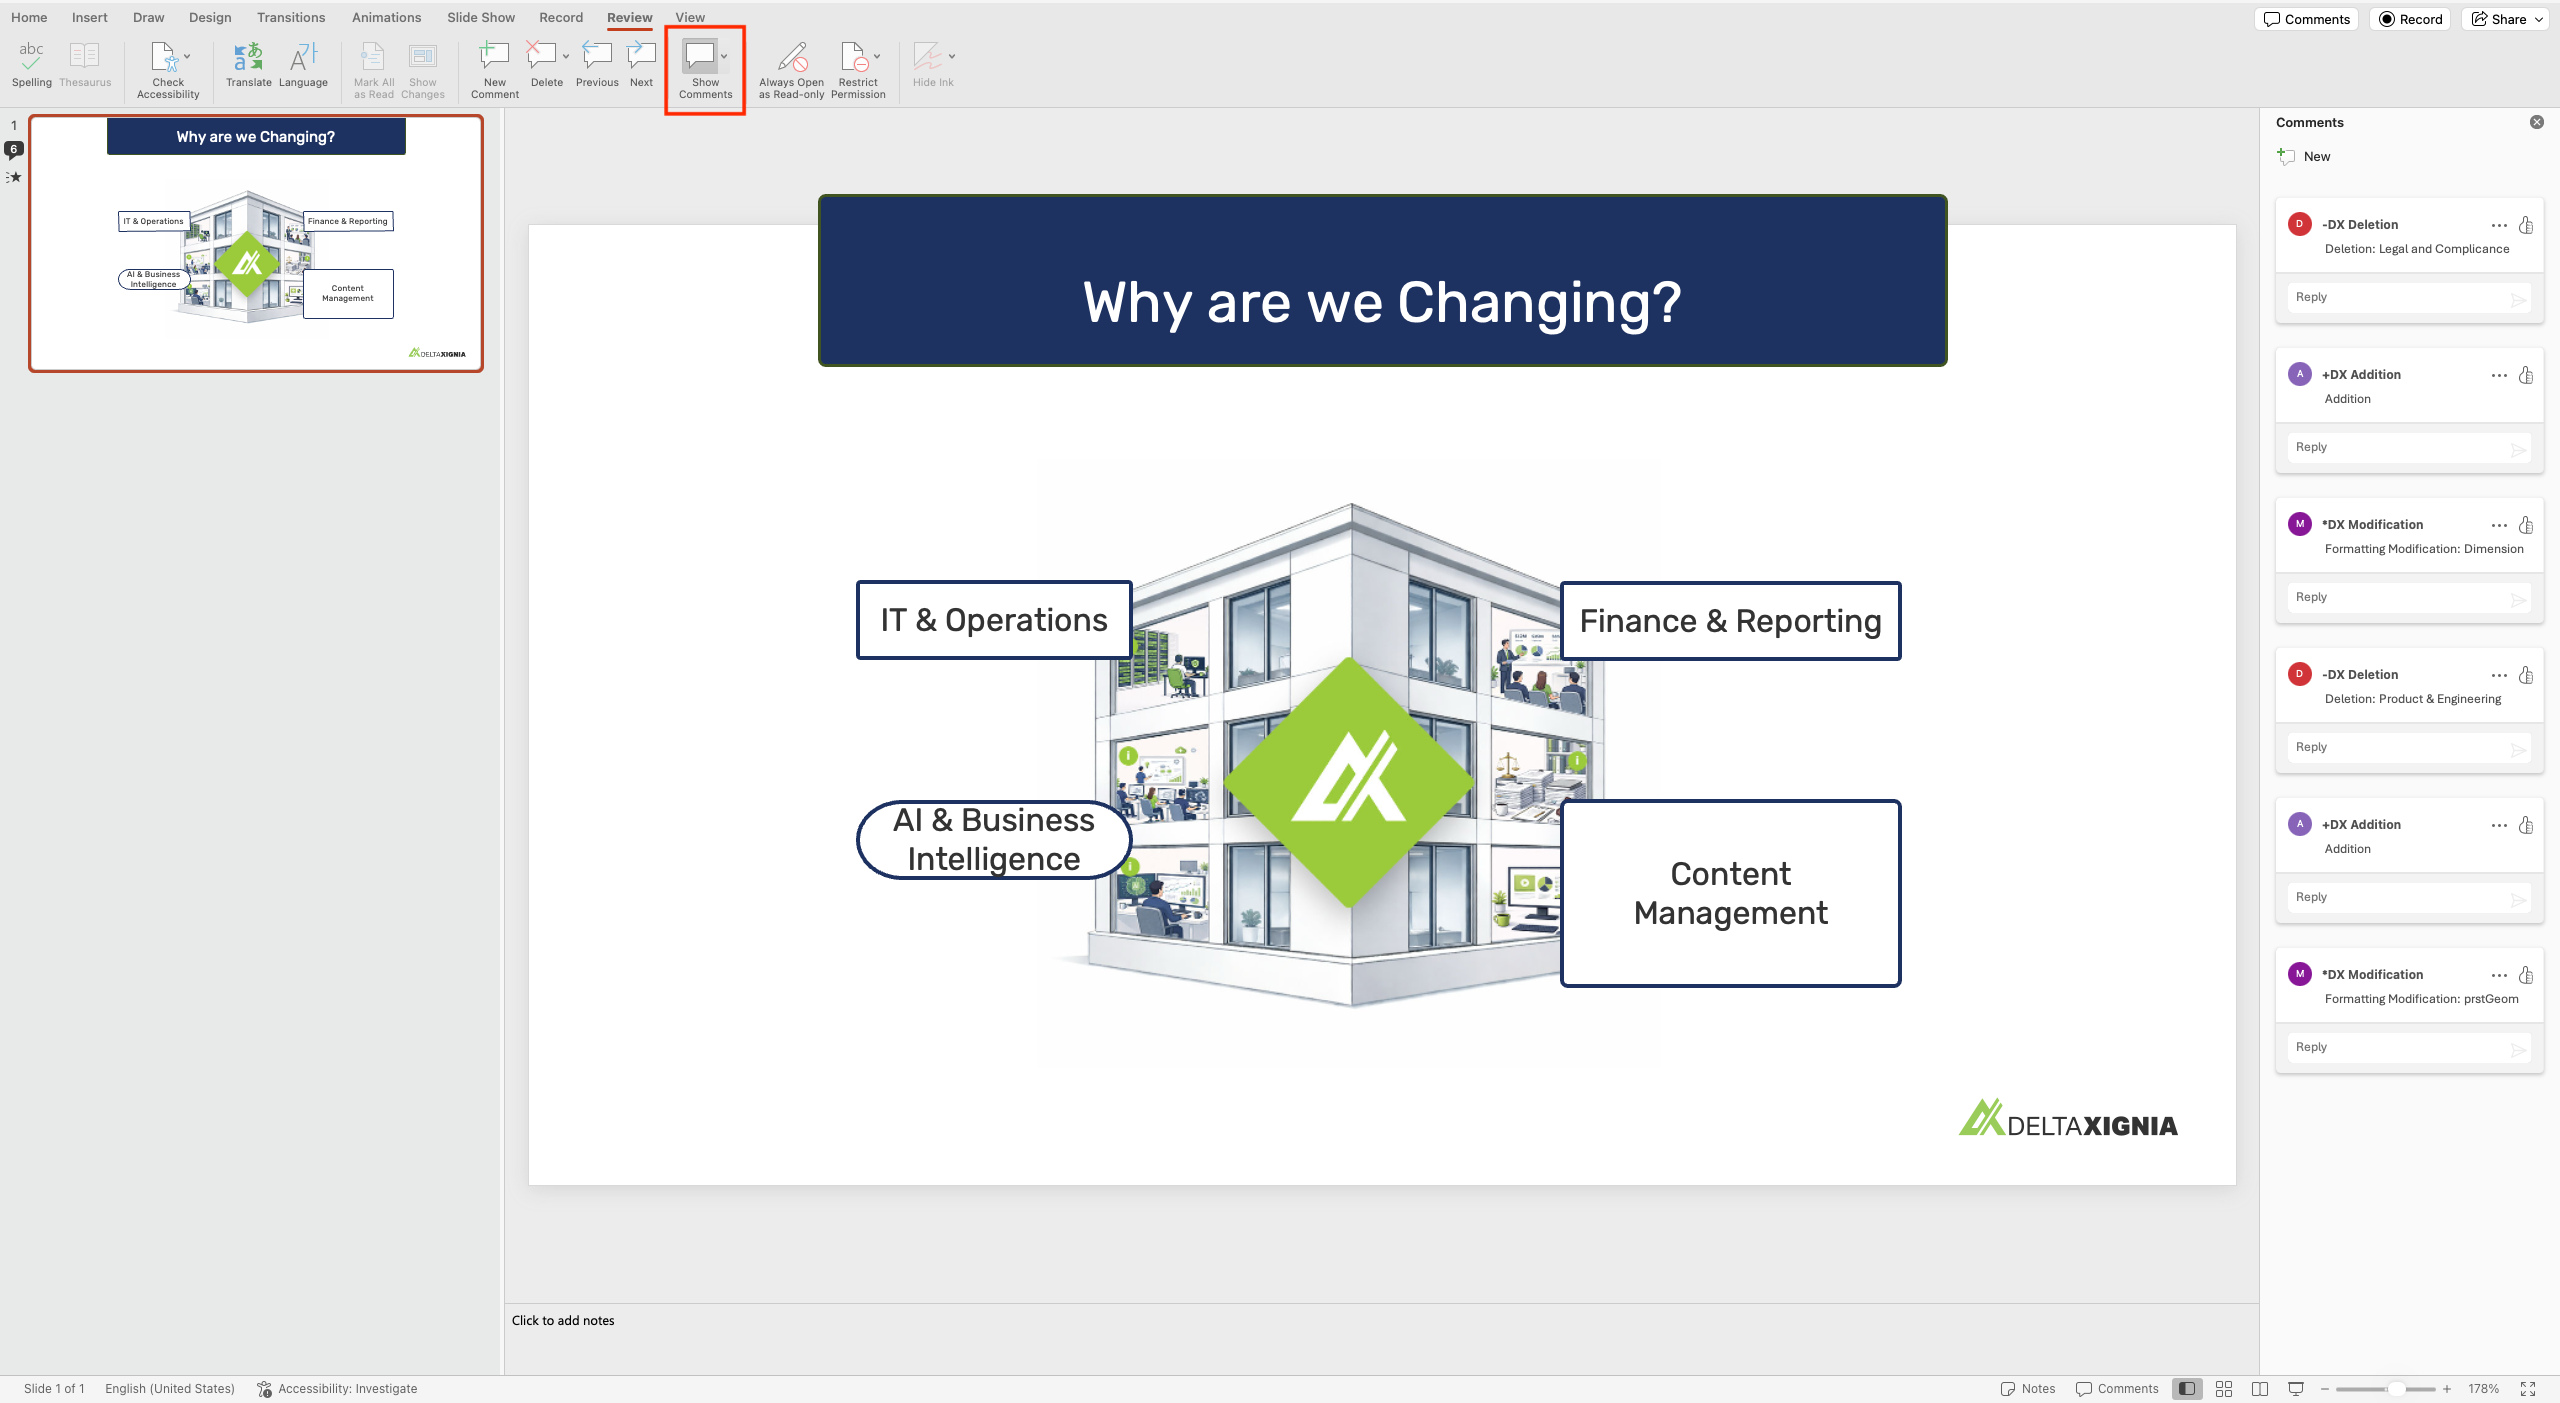
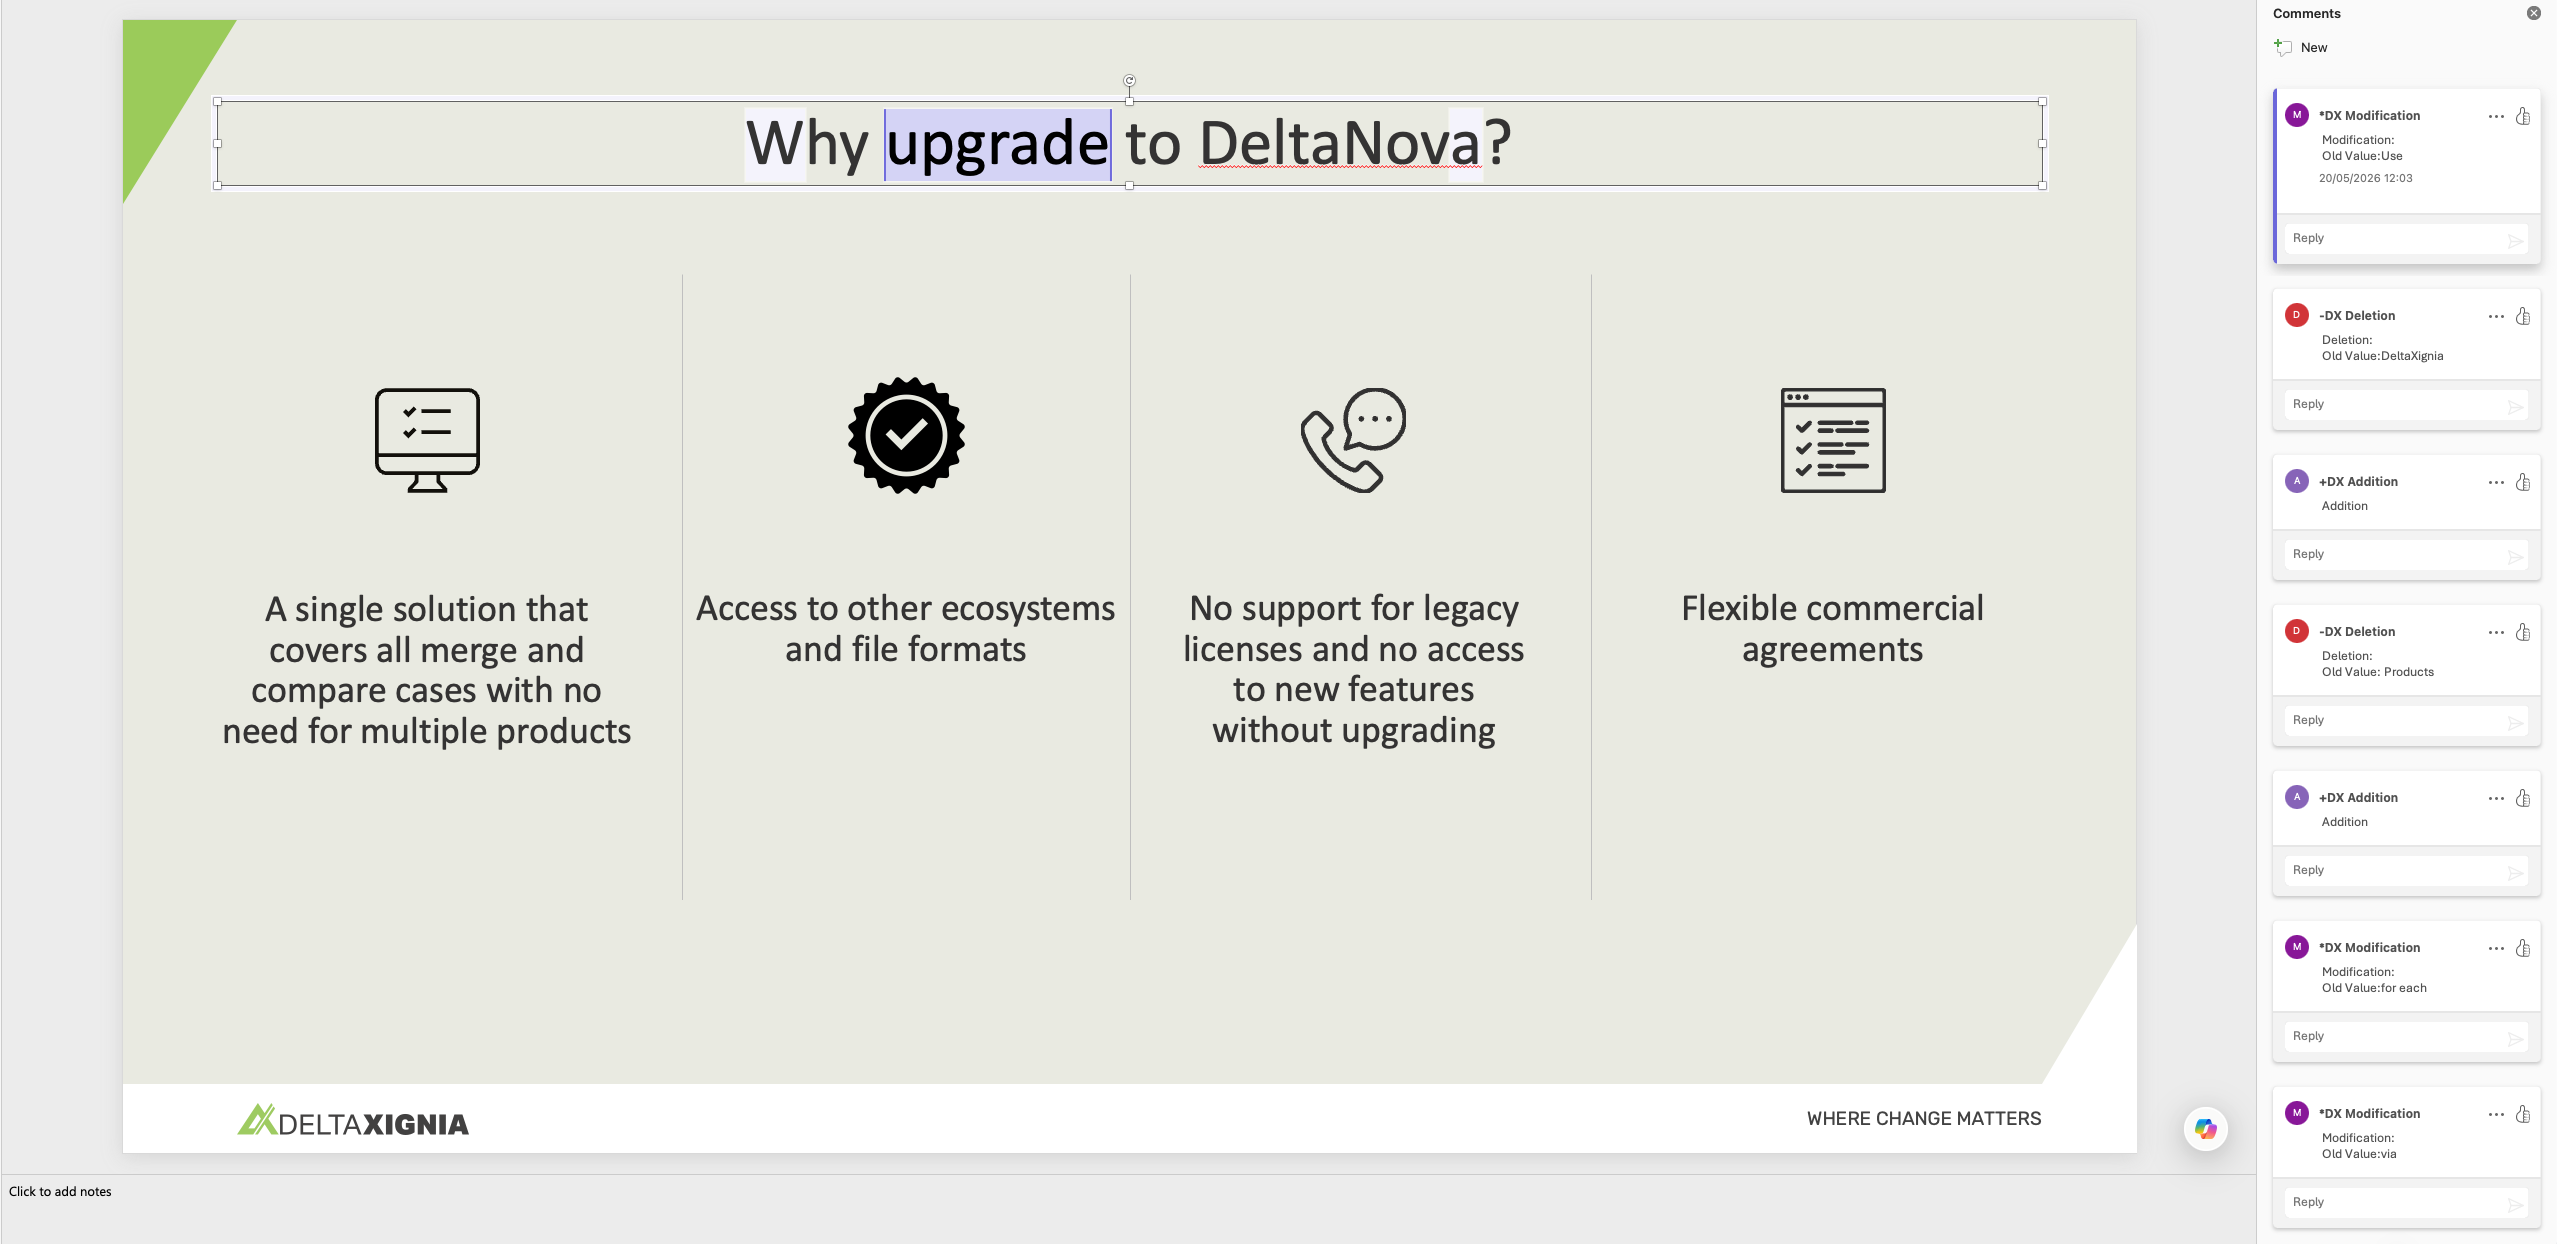
The .pptx result file takes the B input and injects review comments to represent change. In the following example diagram, comments appear from one of 3 DeltaXignia Authors: +Dx Addition, -Dx Deletion, *Dx Modification. These authors can quickly be identified by the A, D, and M icons associated with the author.

Summary Report
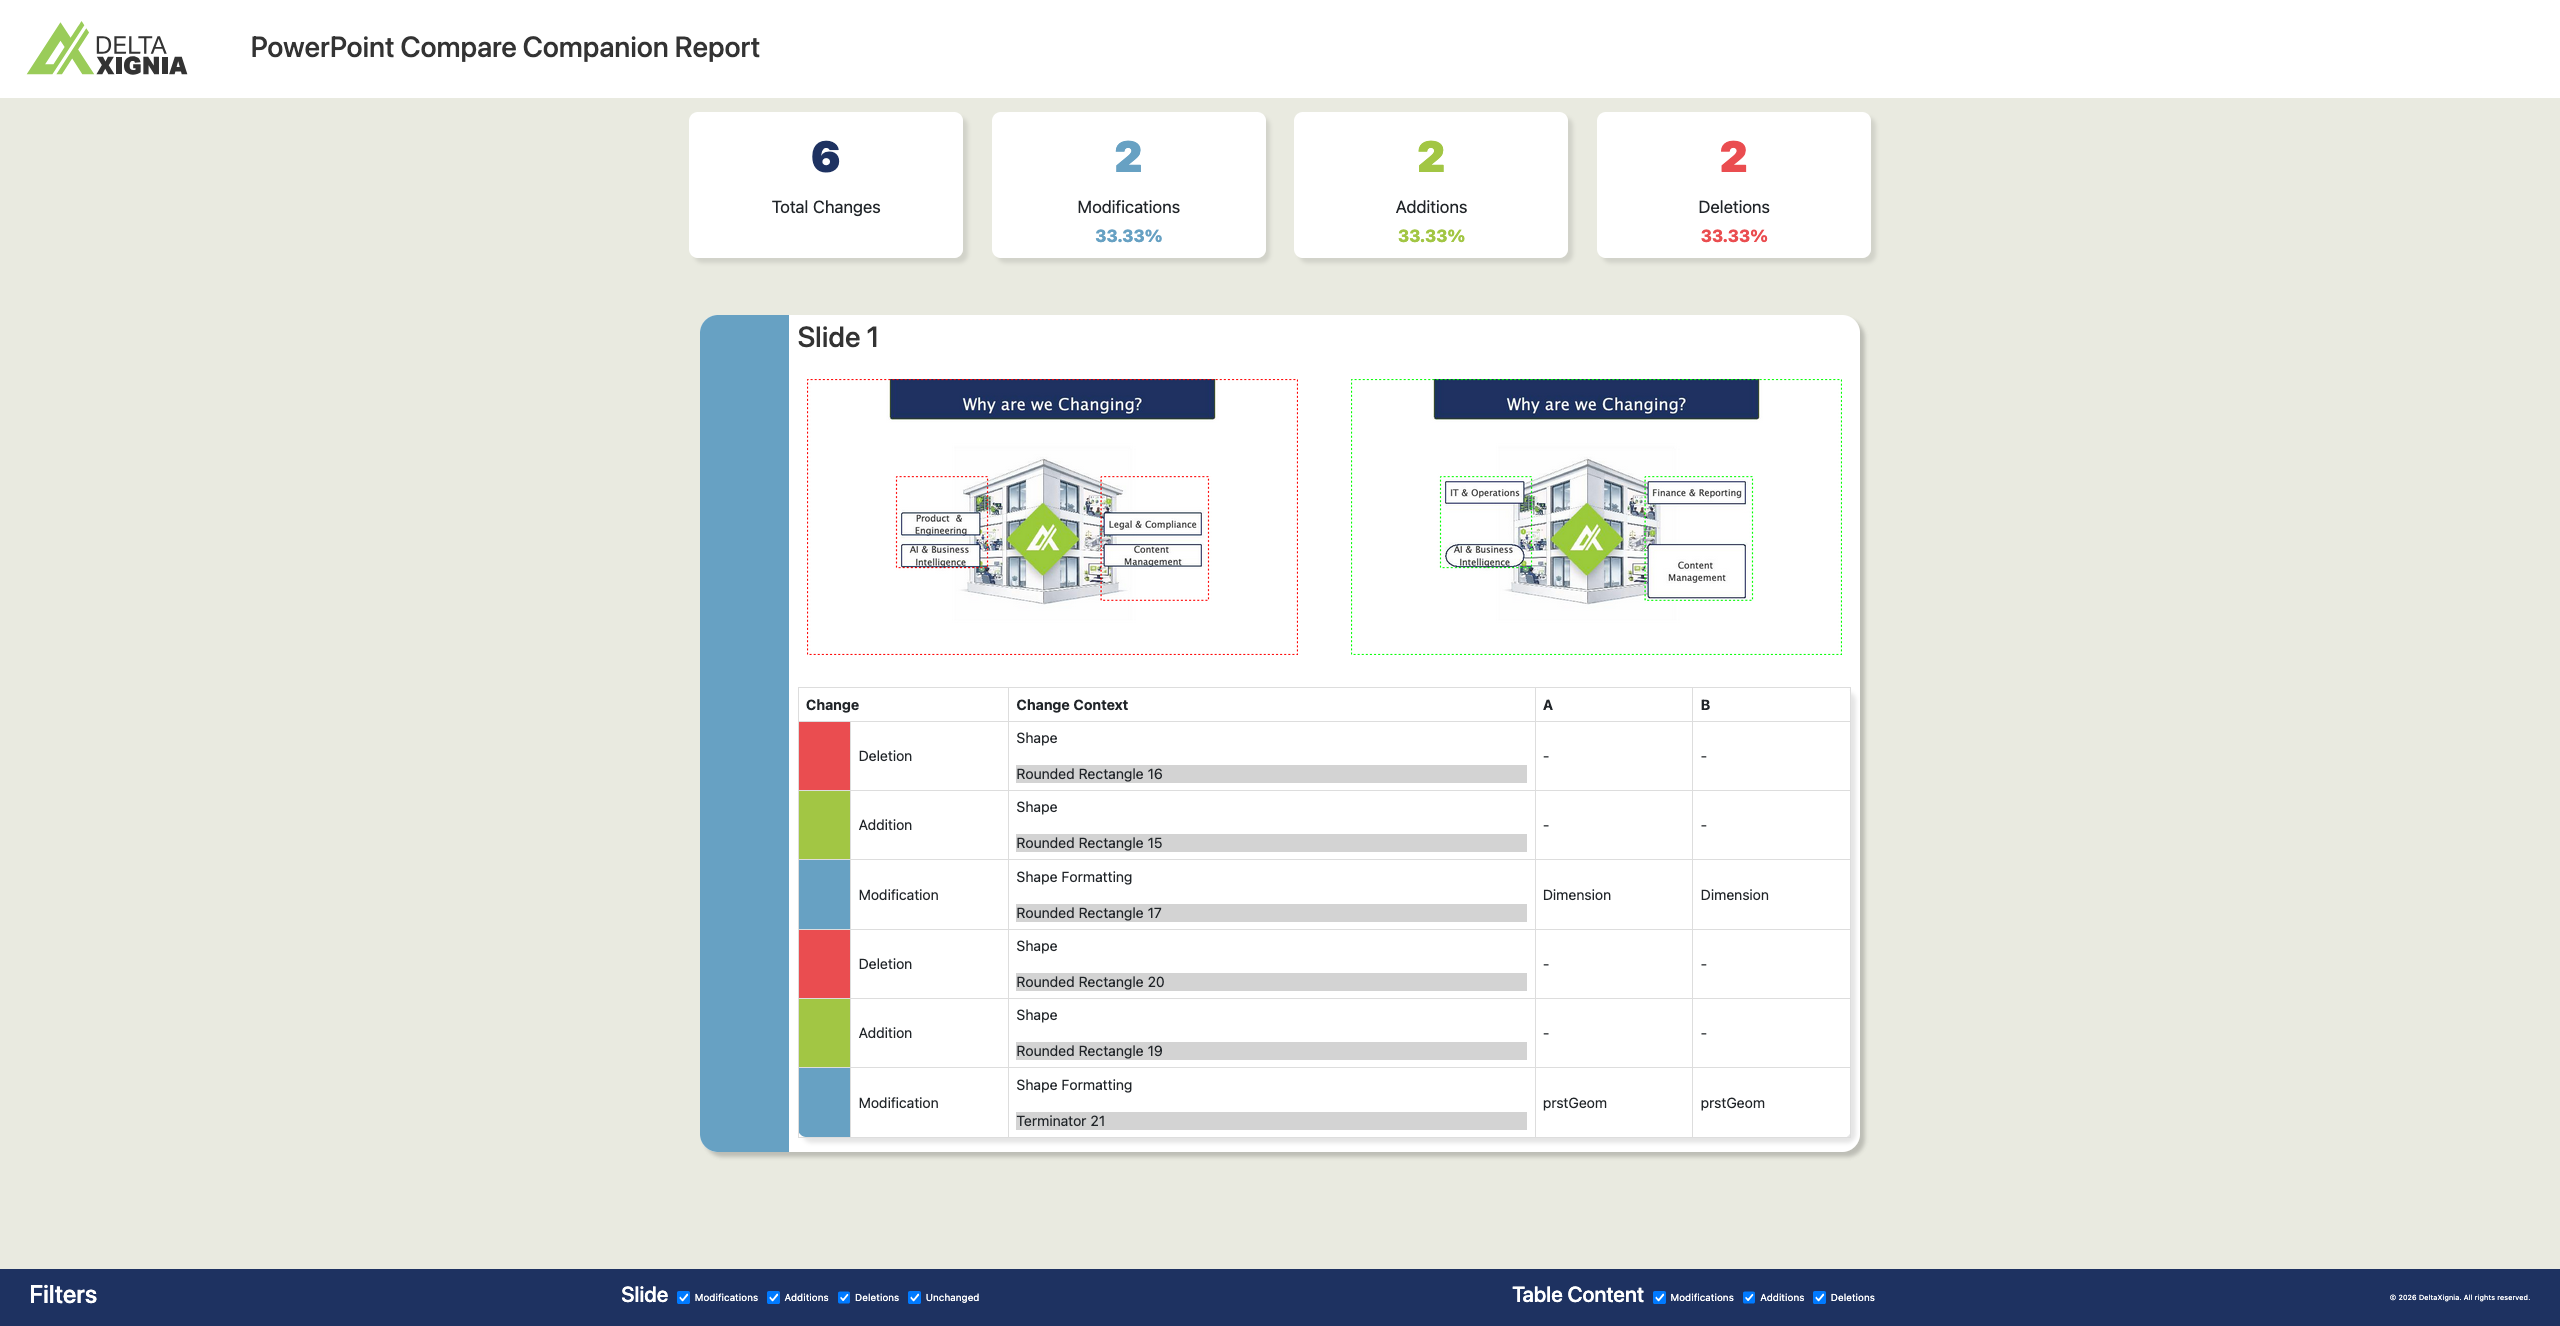
DeltaNova Compare generates a HTML report alongside the .pptx file to provide a structured view of the comparison results providing an easier way to view all the changes.
The report provides flexibility in being able to filter and only show only the changes you care about.
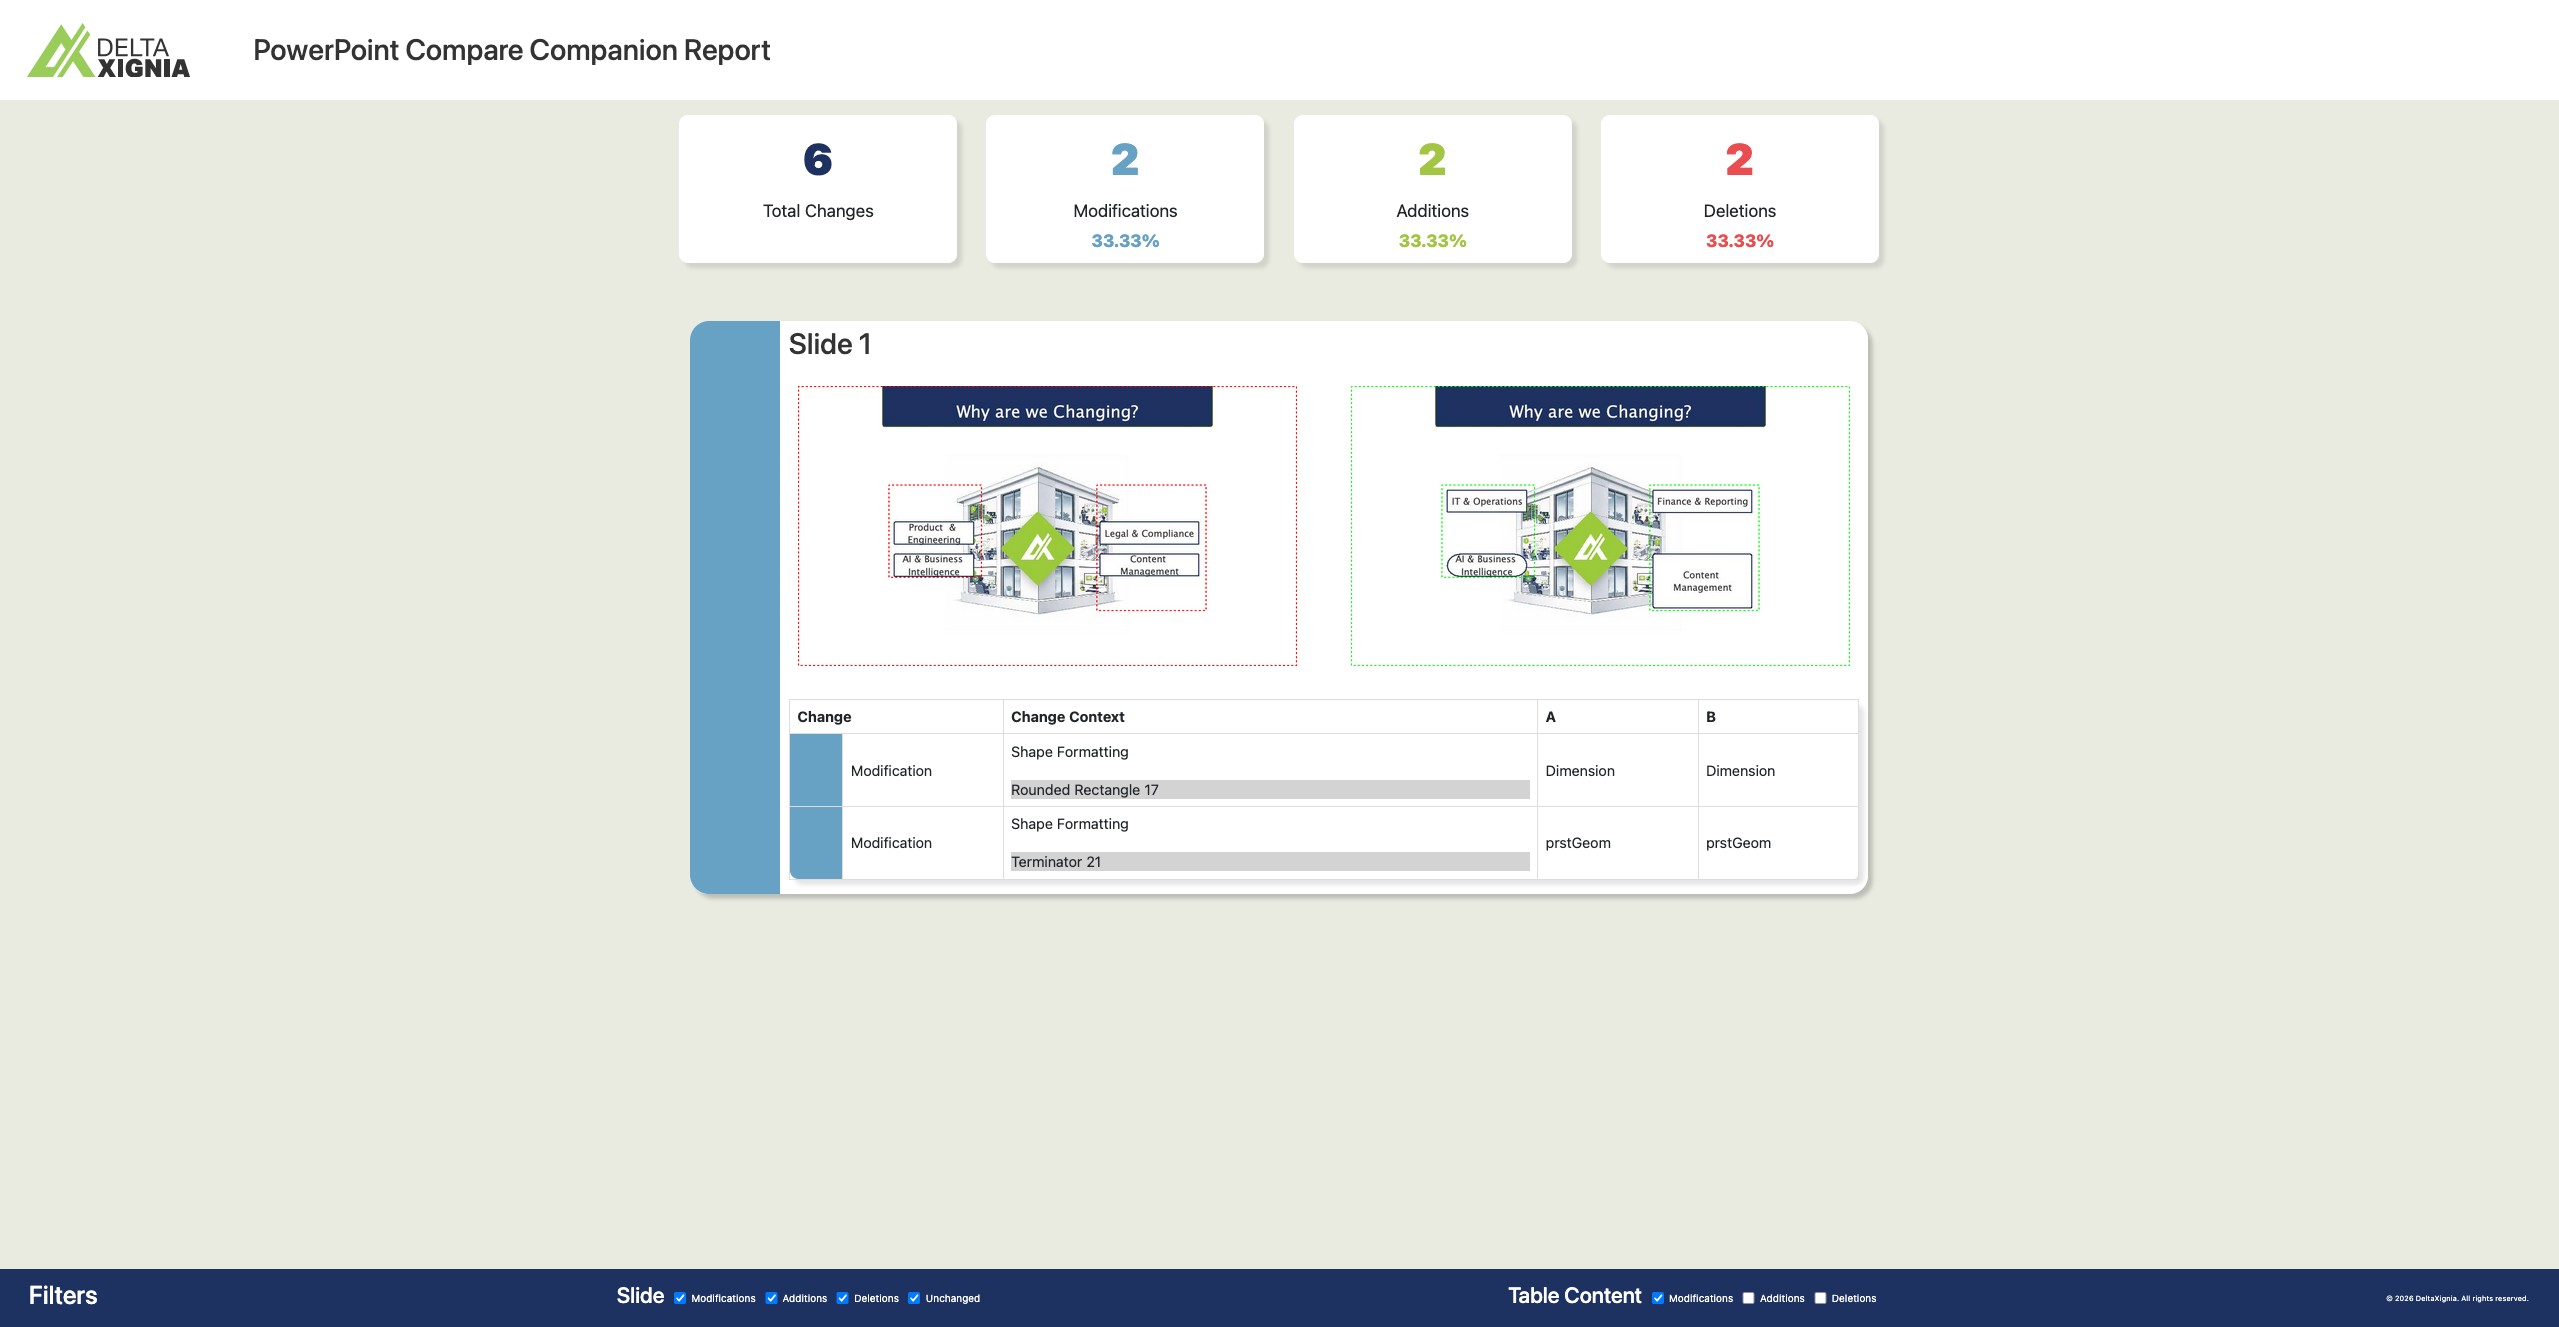
Filters within the footer of the report enable filtering of the changes in the report. Filters enable additions, deletions, and modifications to be filtered out of the report, using two types of filters. Slide-level filters allow added, deleted, modified, or unchanged slides to be filtered out, and the table content-level filters allow changes within the table to be filtered out to quickly see the desired changes.
How DeltaNova PowerPoint Compare Works
This section explains how DeltaNova PowerPoint Compare works, so you can better understand your comparison result and better navigate your result.
Comments Within the PowerPoint Result
Microsoft PowerPoint removed its Compare and Merge functions from Microsoft Office 365. To provide a valid Microsoft PowerPoint presentation output, DeltaNova PowerPoint Compare uses the Comments feature that remains. You can view comments from the Review tab, and see information about the change, and follow links to the respective changed content within the slide.
Shapes Representation
To best understand the changes to shapes when reviewing comments or viewing the report, follow these steps.
-
In Microsoft PowerPoint, select Home tab > Arrange > Selection Pane. navigate to and turn on the Selection Pane’ via the ‘Arrange’ section in ‘Home’ tab to view the names and even change the names of shapes used in your PowerPoint Inputs.



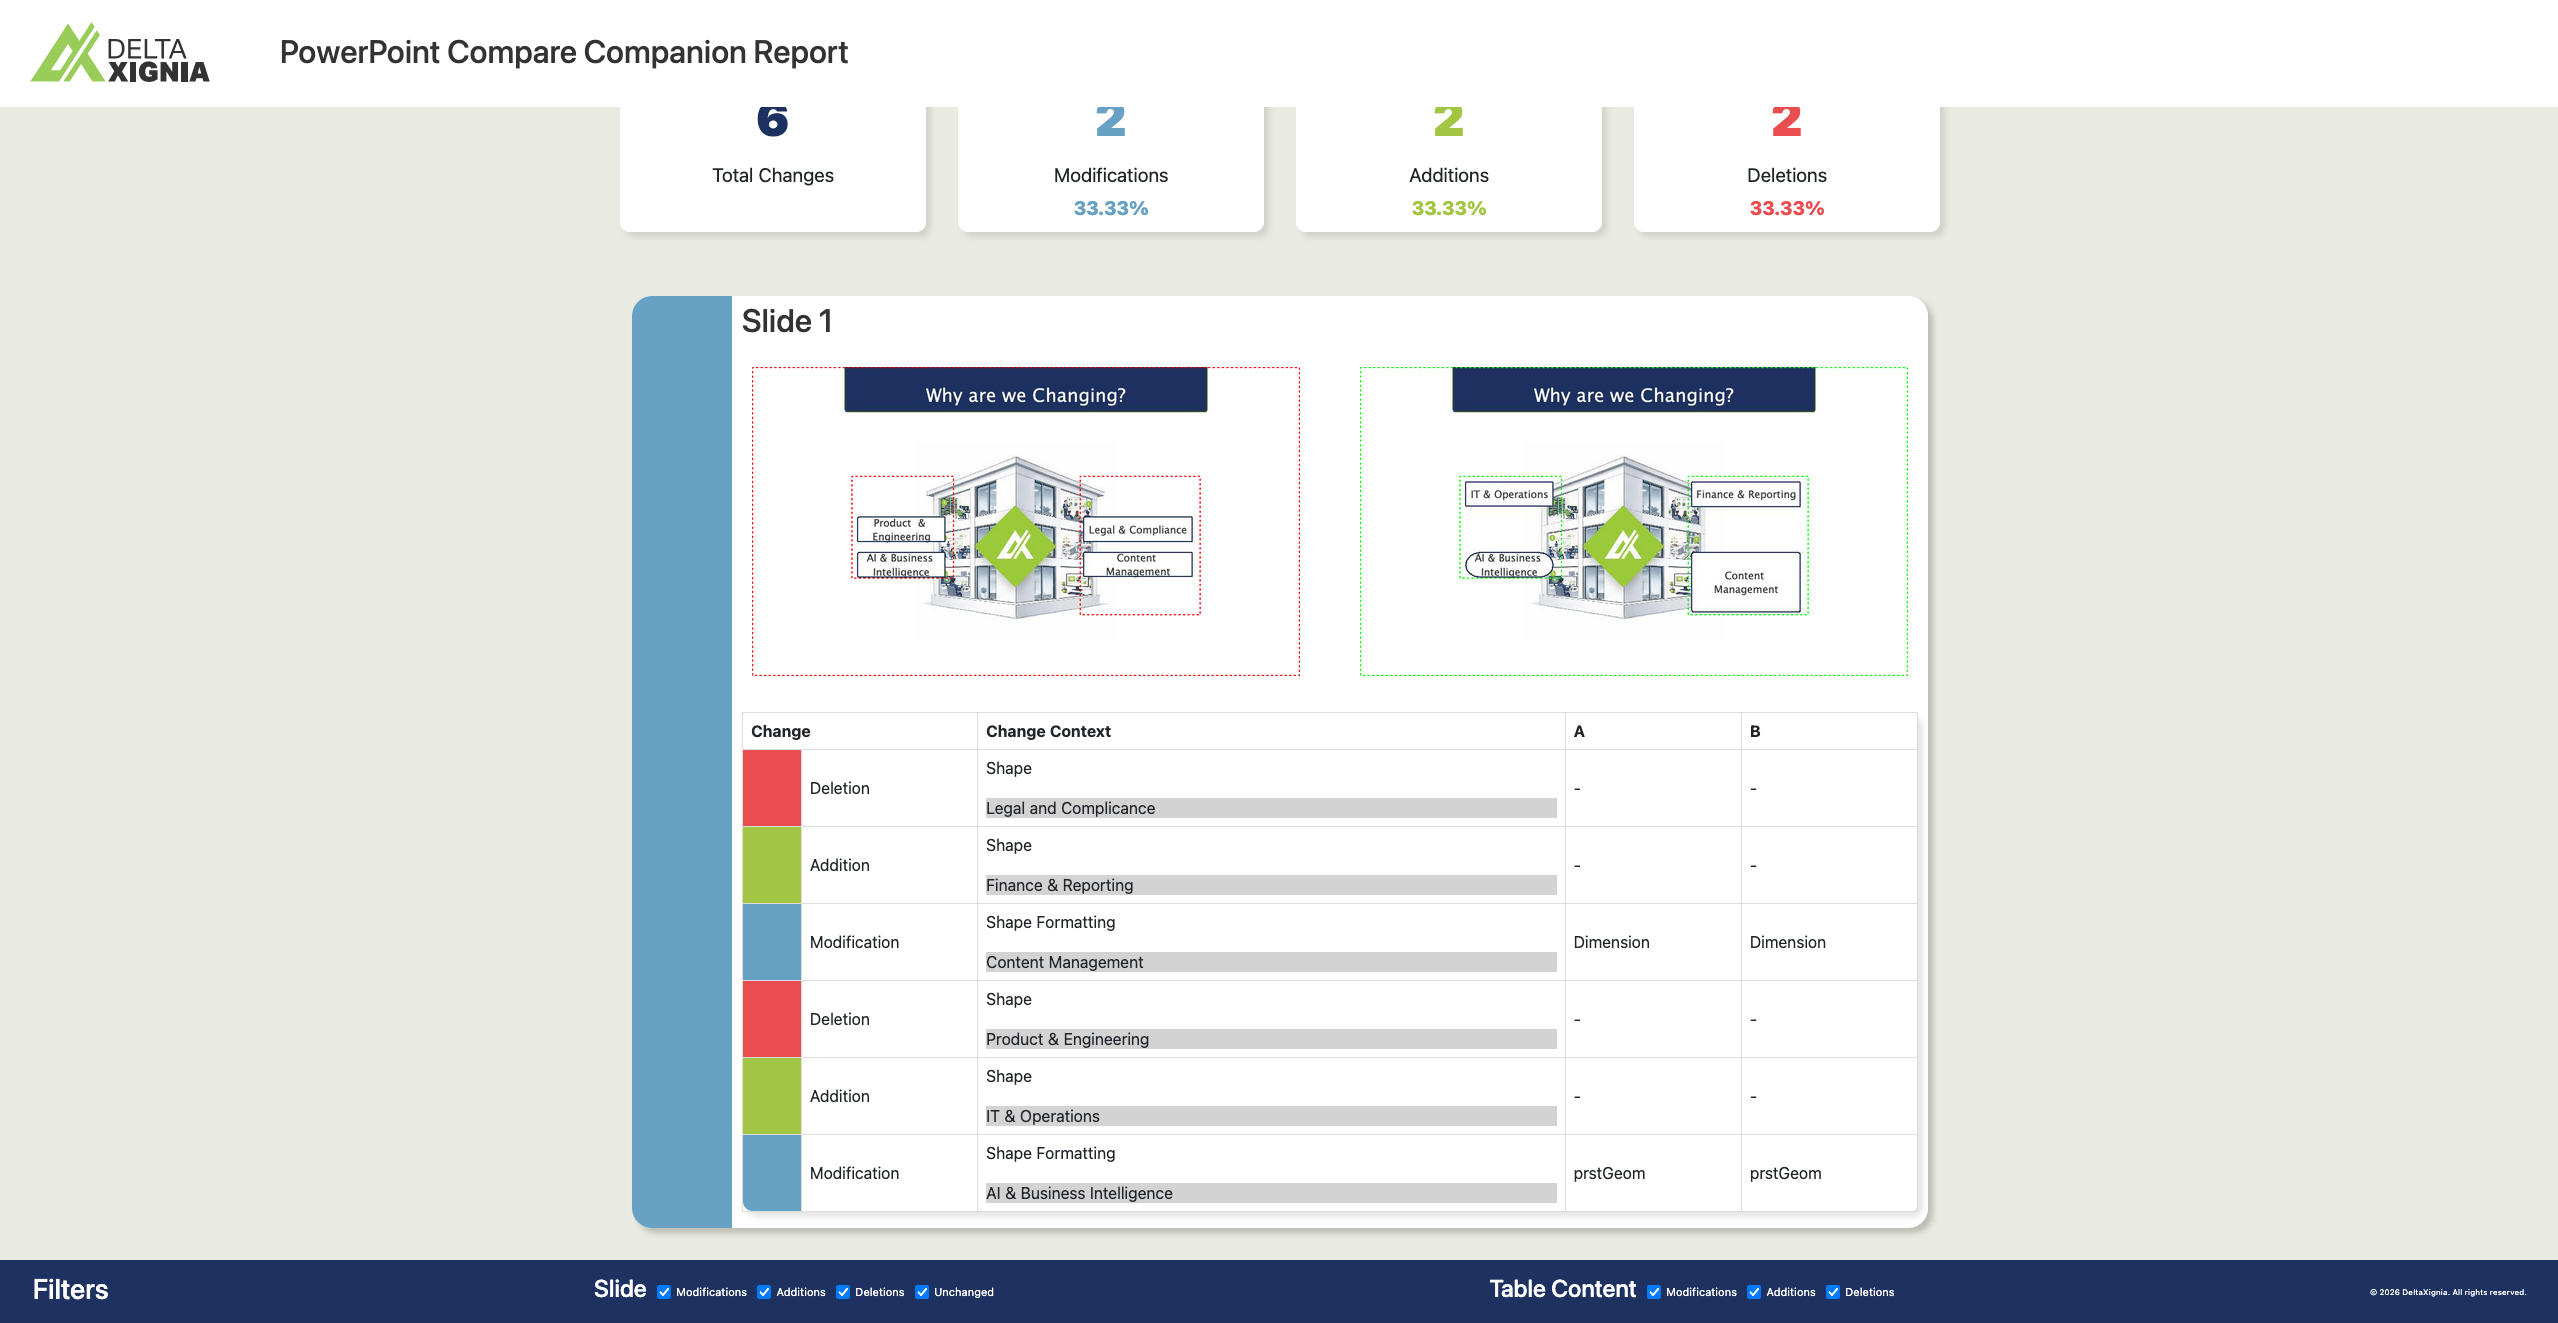
The names of the renamed shapes appear in the report, which can help with quick identification of the changed parts when combined with the rendered slides above the table, or the PowerPoint result itself.

Examples
Text
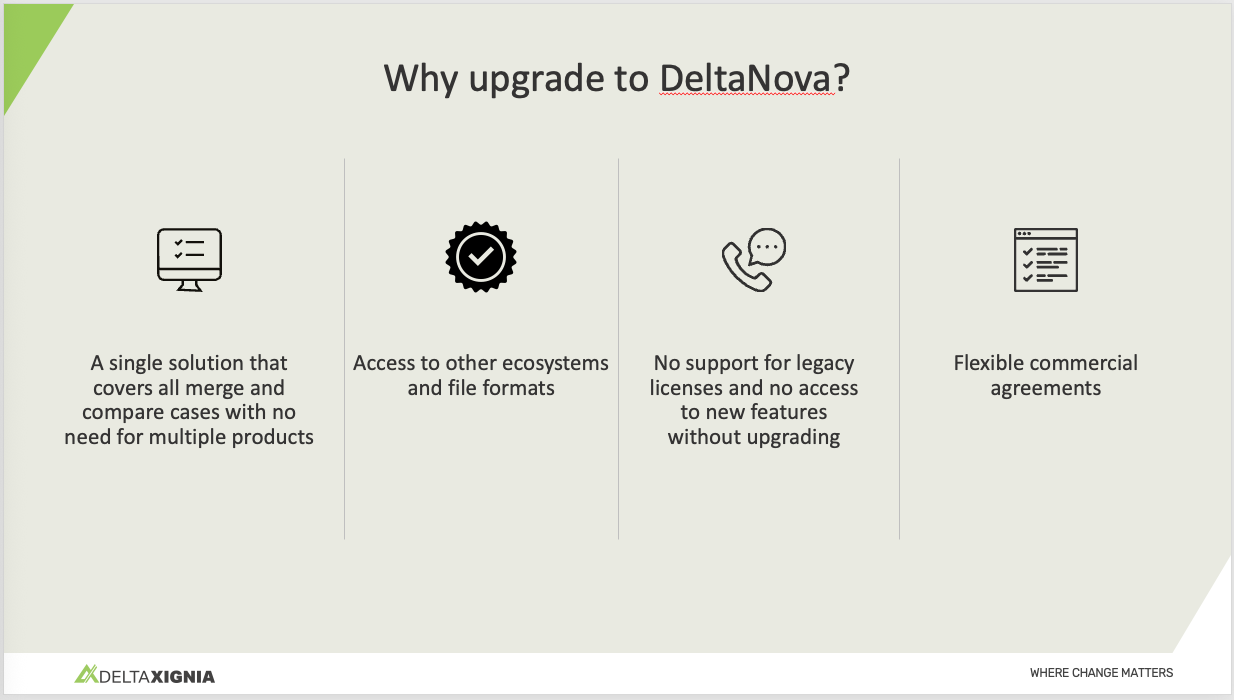
The two inputs show a slides with a variety of text changes applied, including additions, deletion, and modifications.

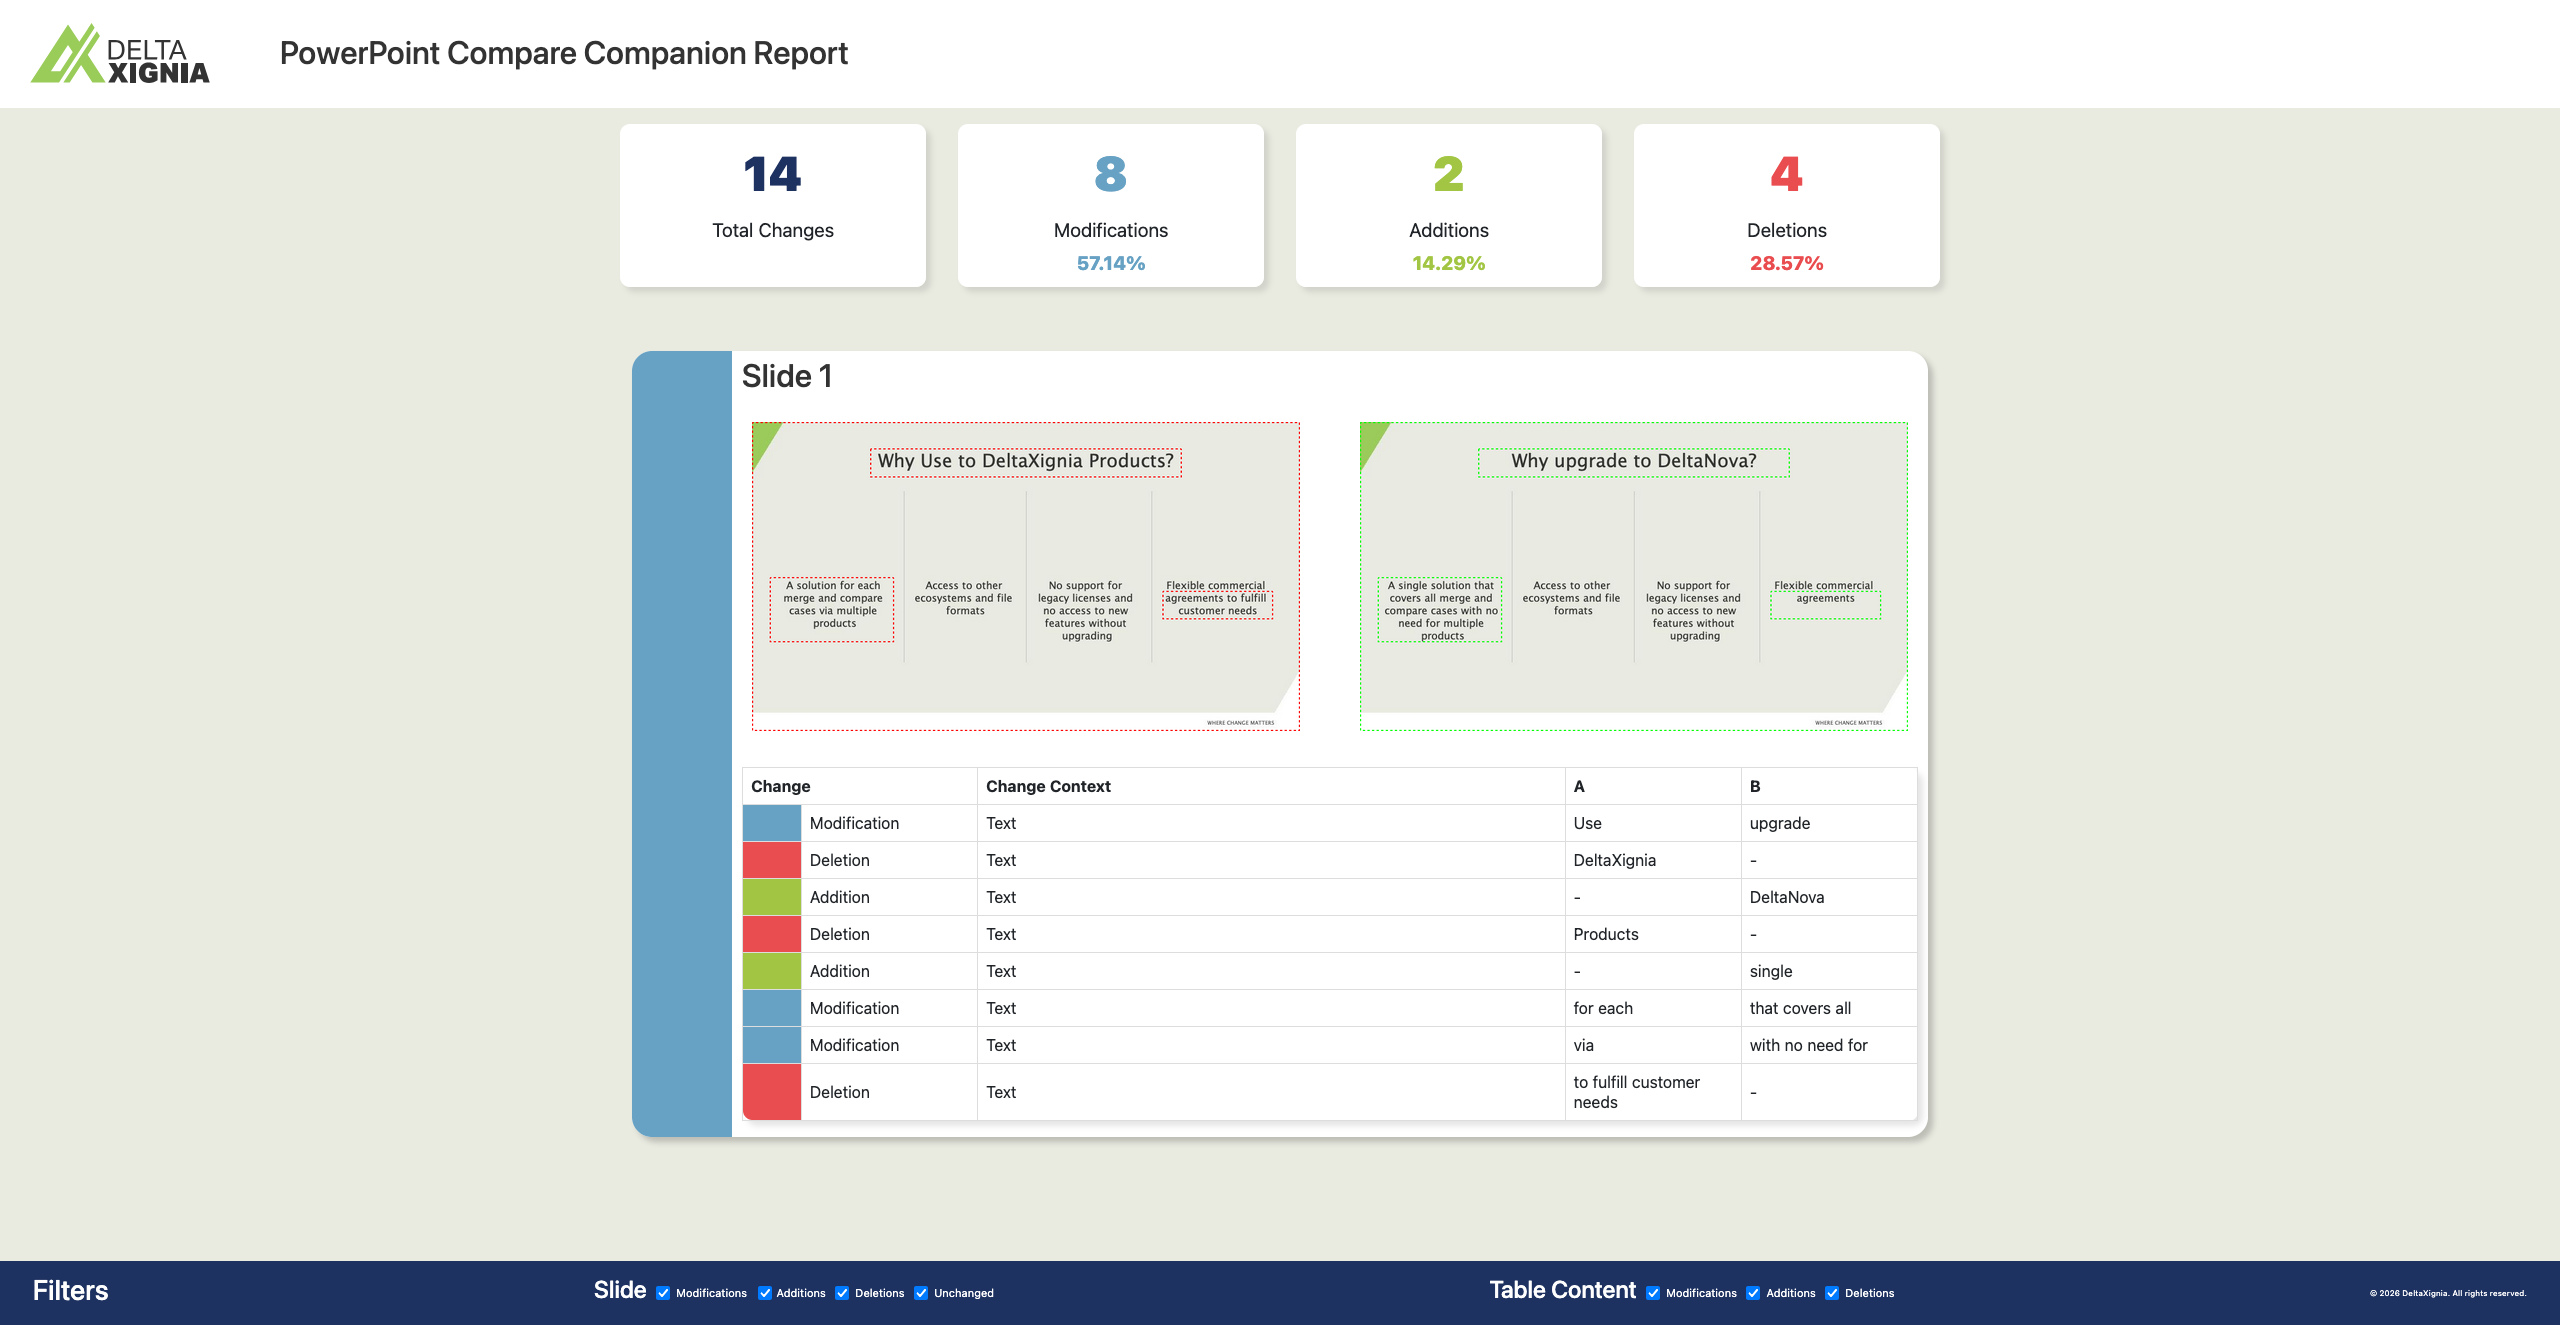
The changes are shown in the resulting Microsoft PowerPoint file as comments, with each comment highlighting the corresponding text change when you select it. In the report, the same comments appear in a table, below the renderings of the two slides with boxes highlighting change.
Shapes Addition, Deletion, Modification
The two inputs show slides with shapes that have been added, deleted and modified.


In the PowerPoint result the changes to the shapes are identified with comments which highlight the relevant shape when selected. In the report the changes are identified in the table for the slide and highlighted via bounding boxes in the slide rendering
Images Modification
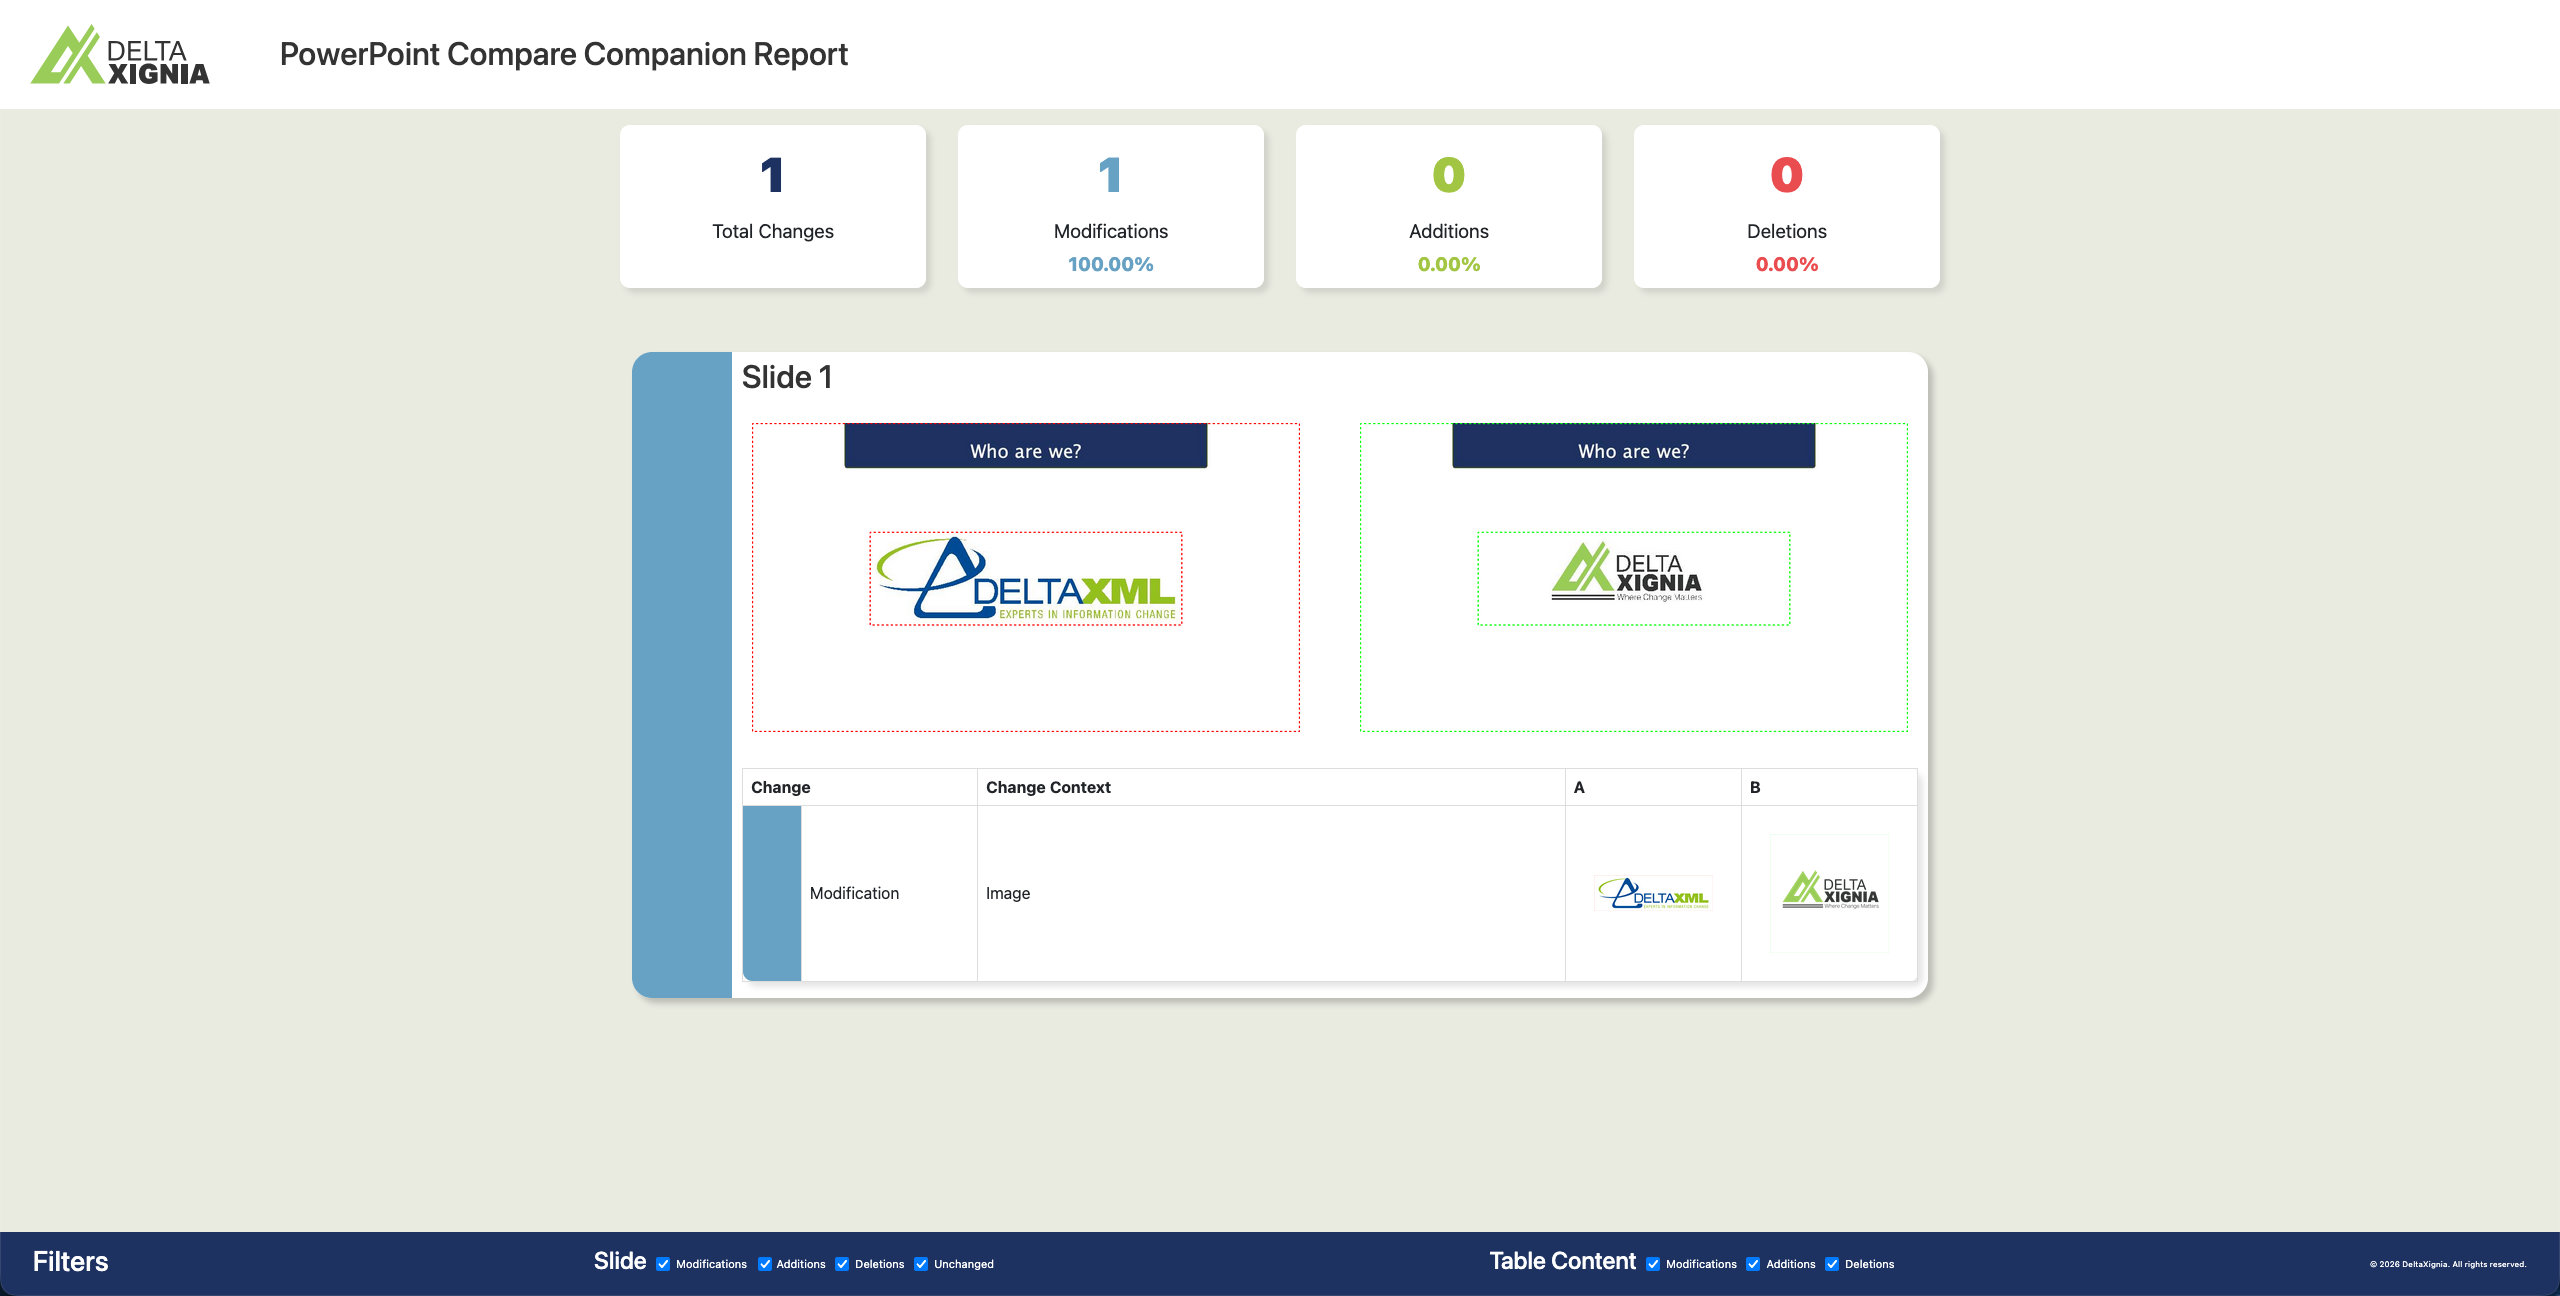
The two inputs show slides with Images that have been modified.


Image modifications are represented with comments in the PowerPoint result, and in the report the relevant row in the table shows a A and B versions of Binary Image Compared images which highlight the image differences with bounding boxes.

Slide Level Changes
Slide Addition
These two inputs show an added second slide to the B Input.
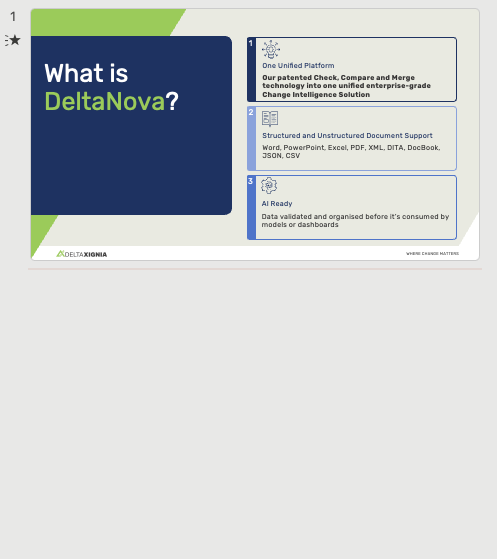
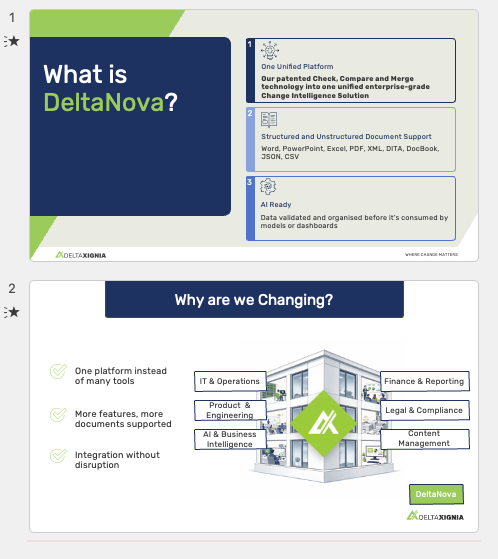
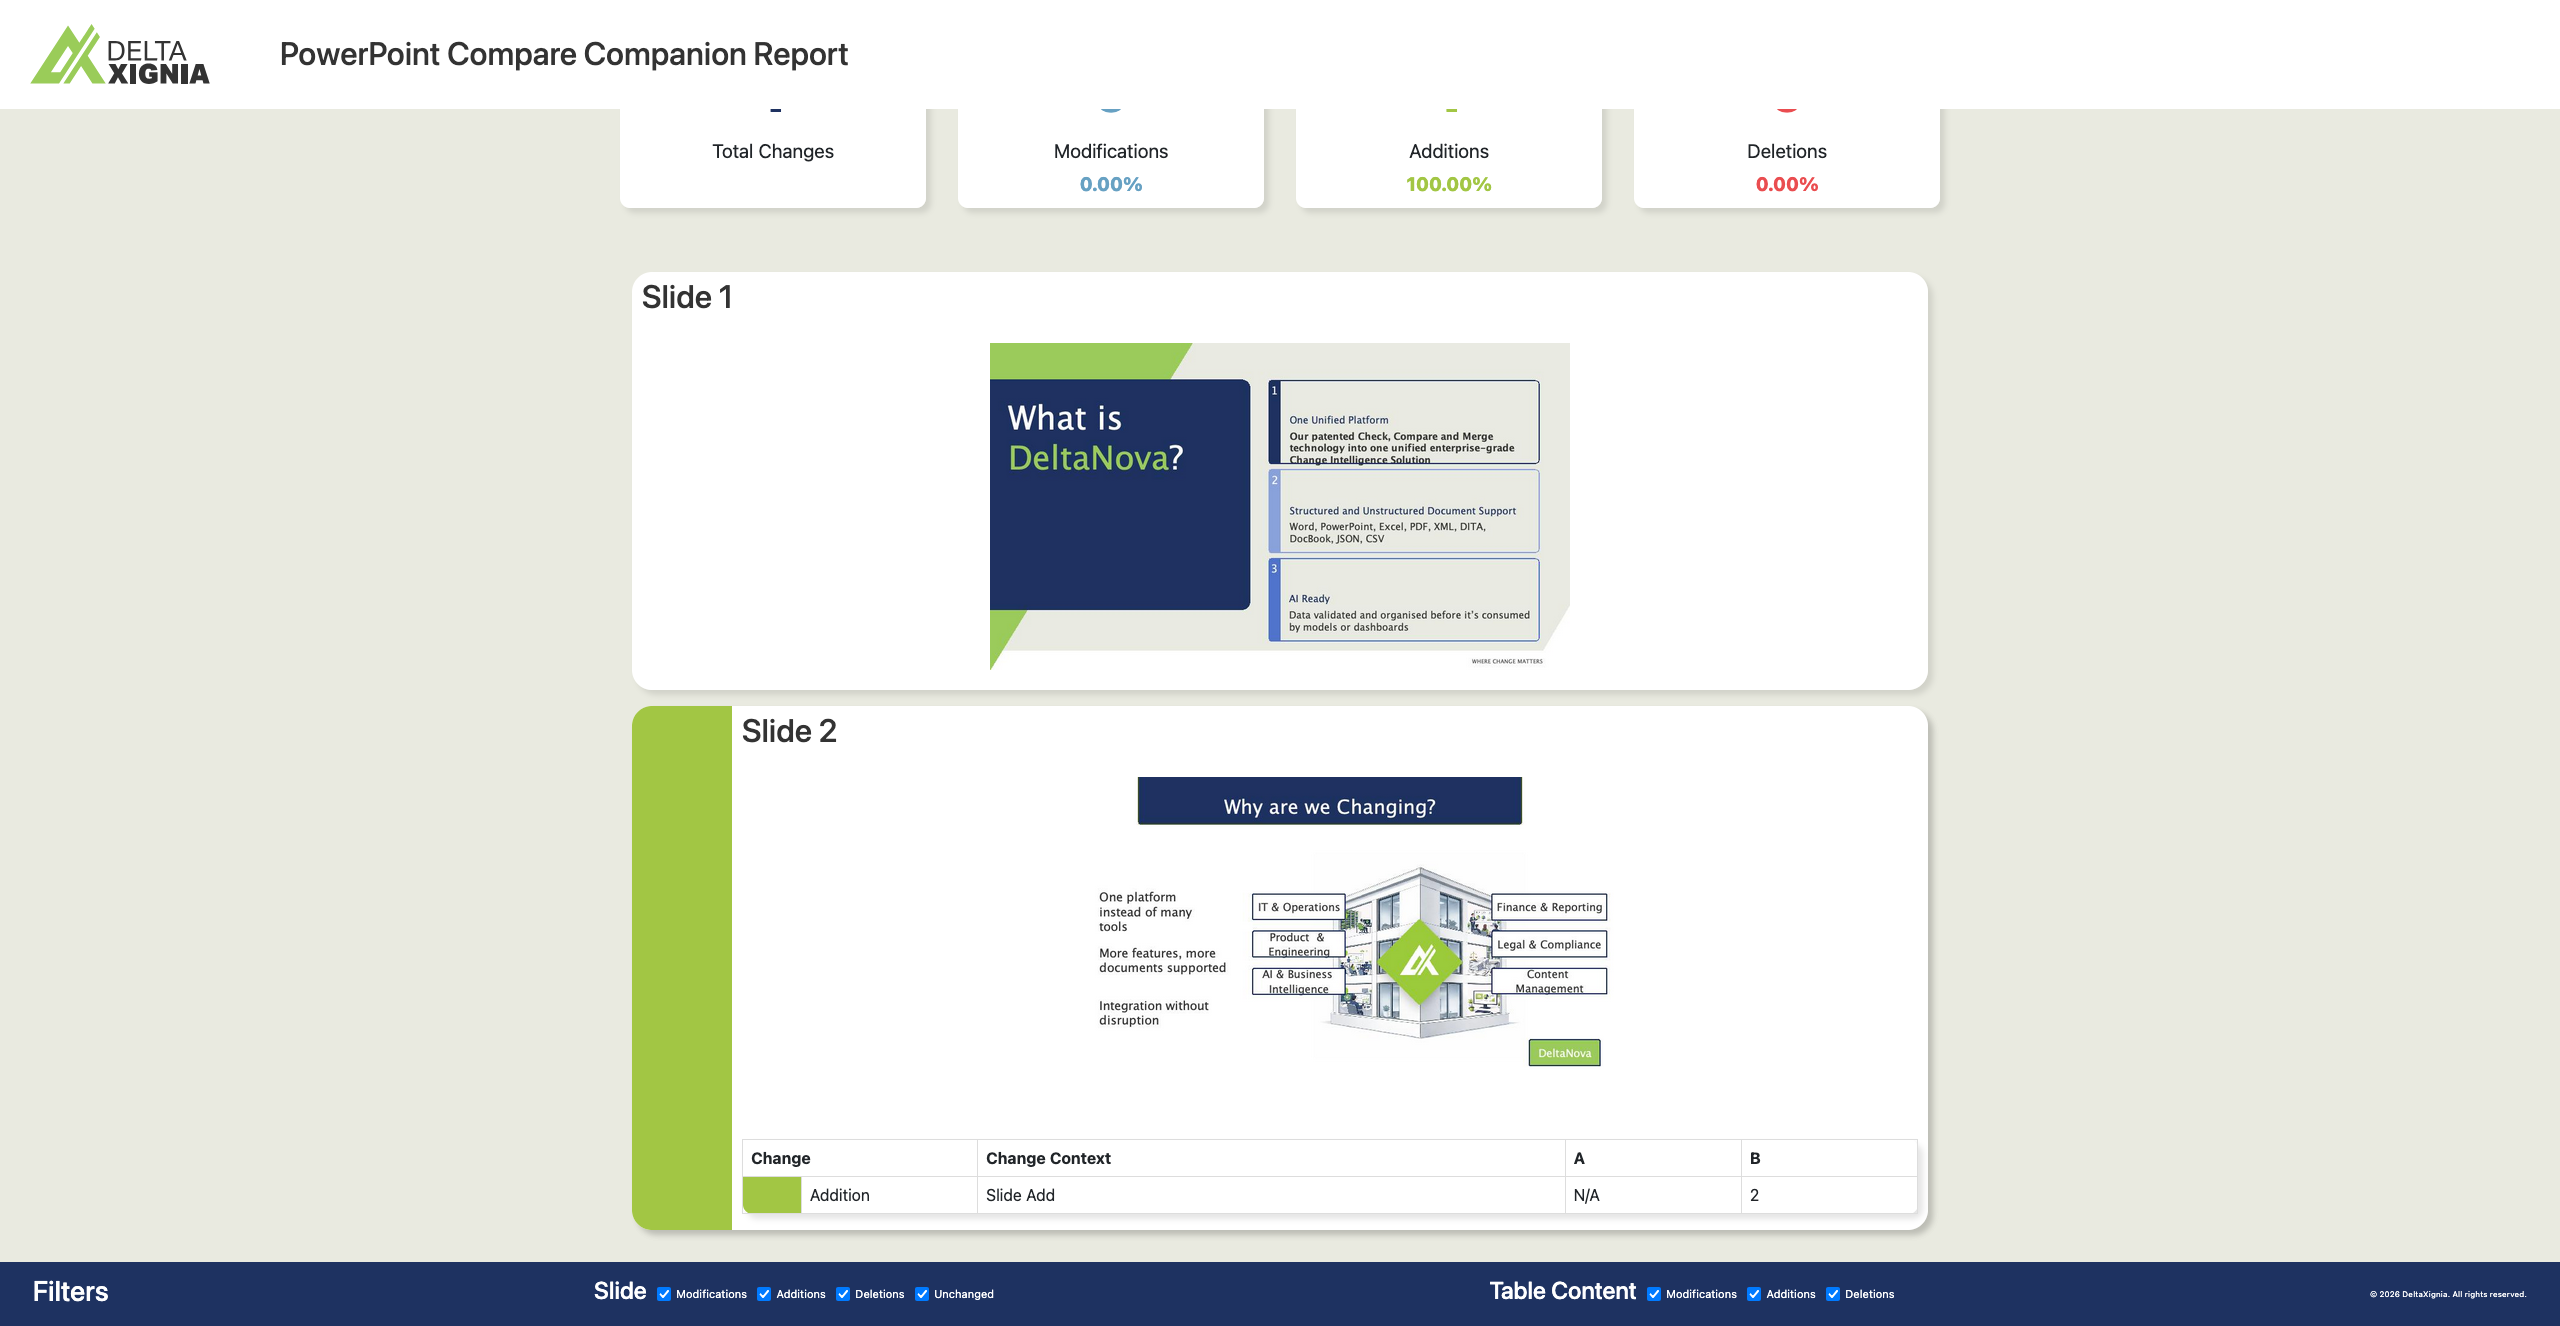
The result represents the slide addition with a comment attached to the slides stating its addition, and in the report through a green border, and the relevant Slide Added comment.

Slide Deletion
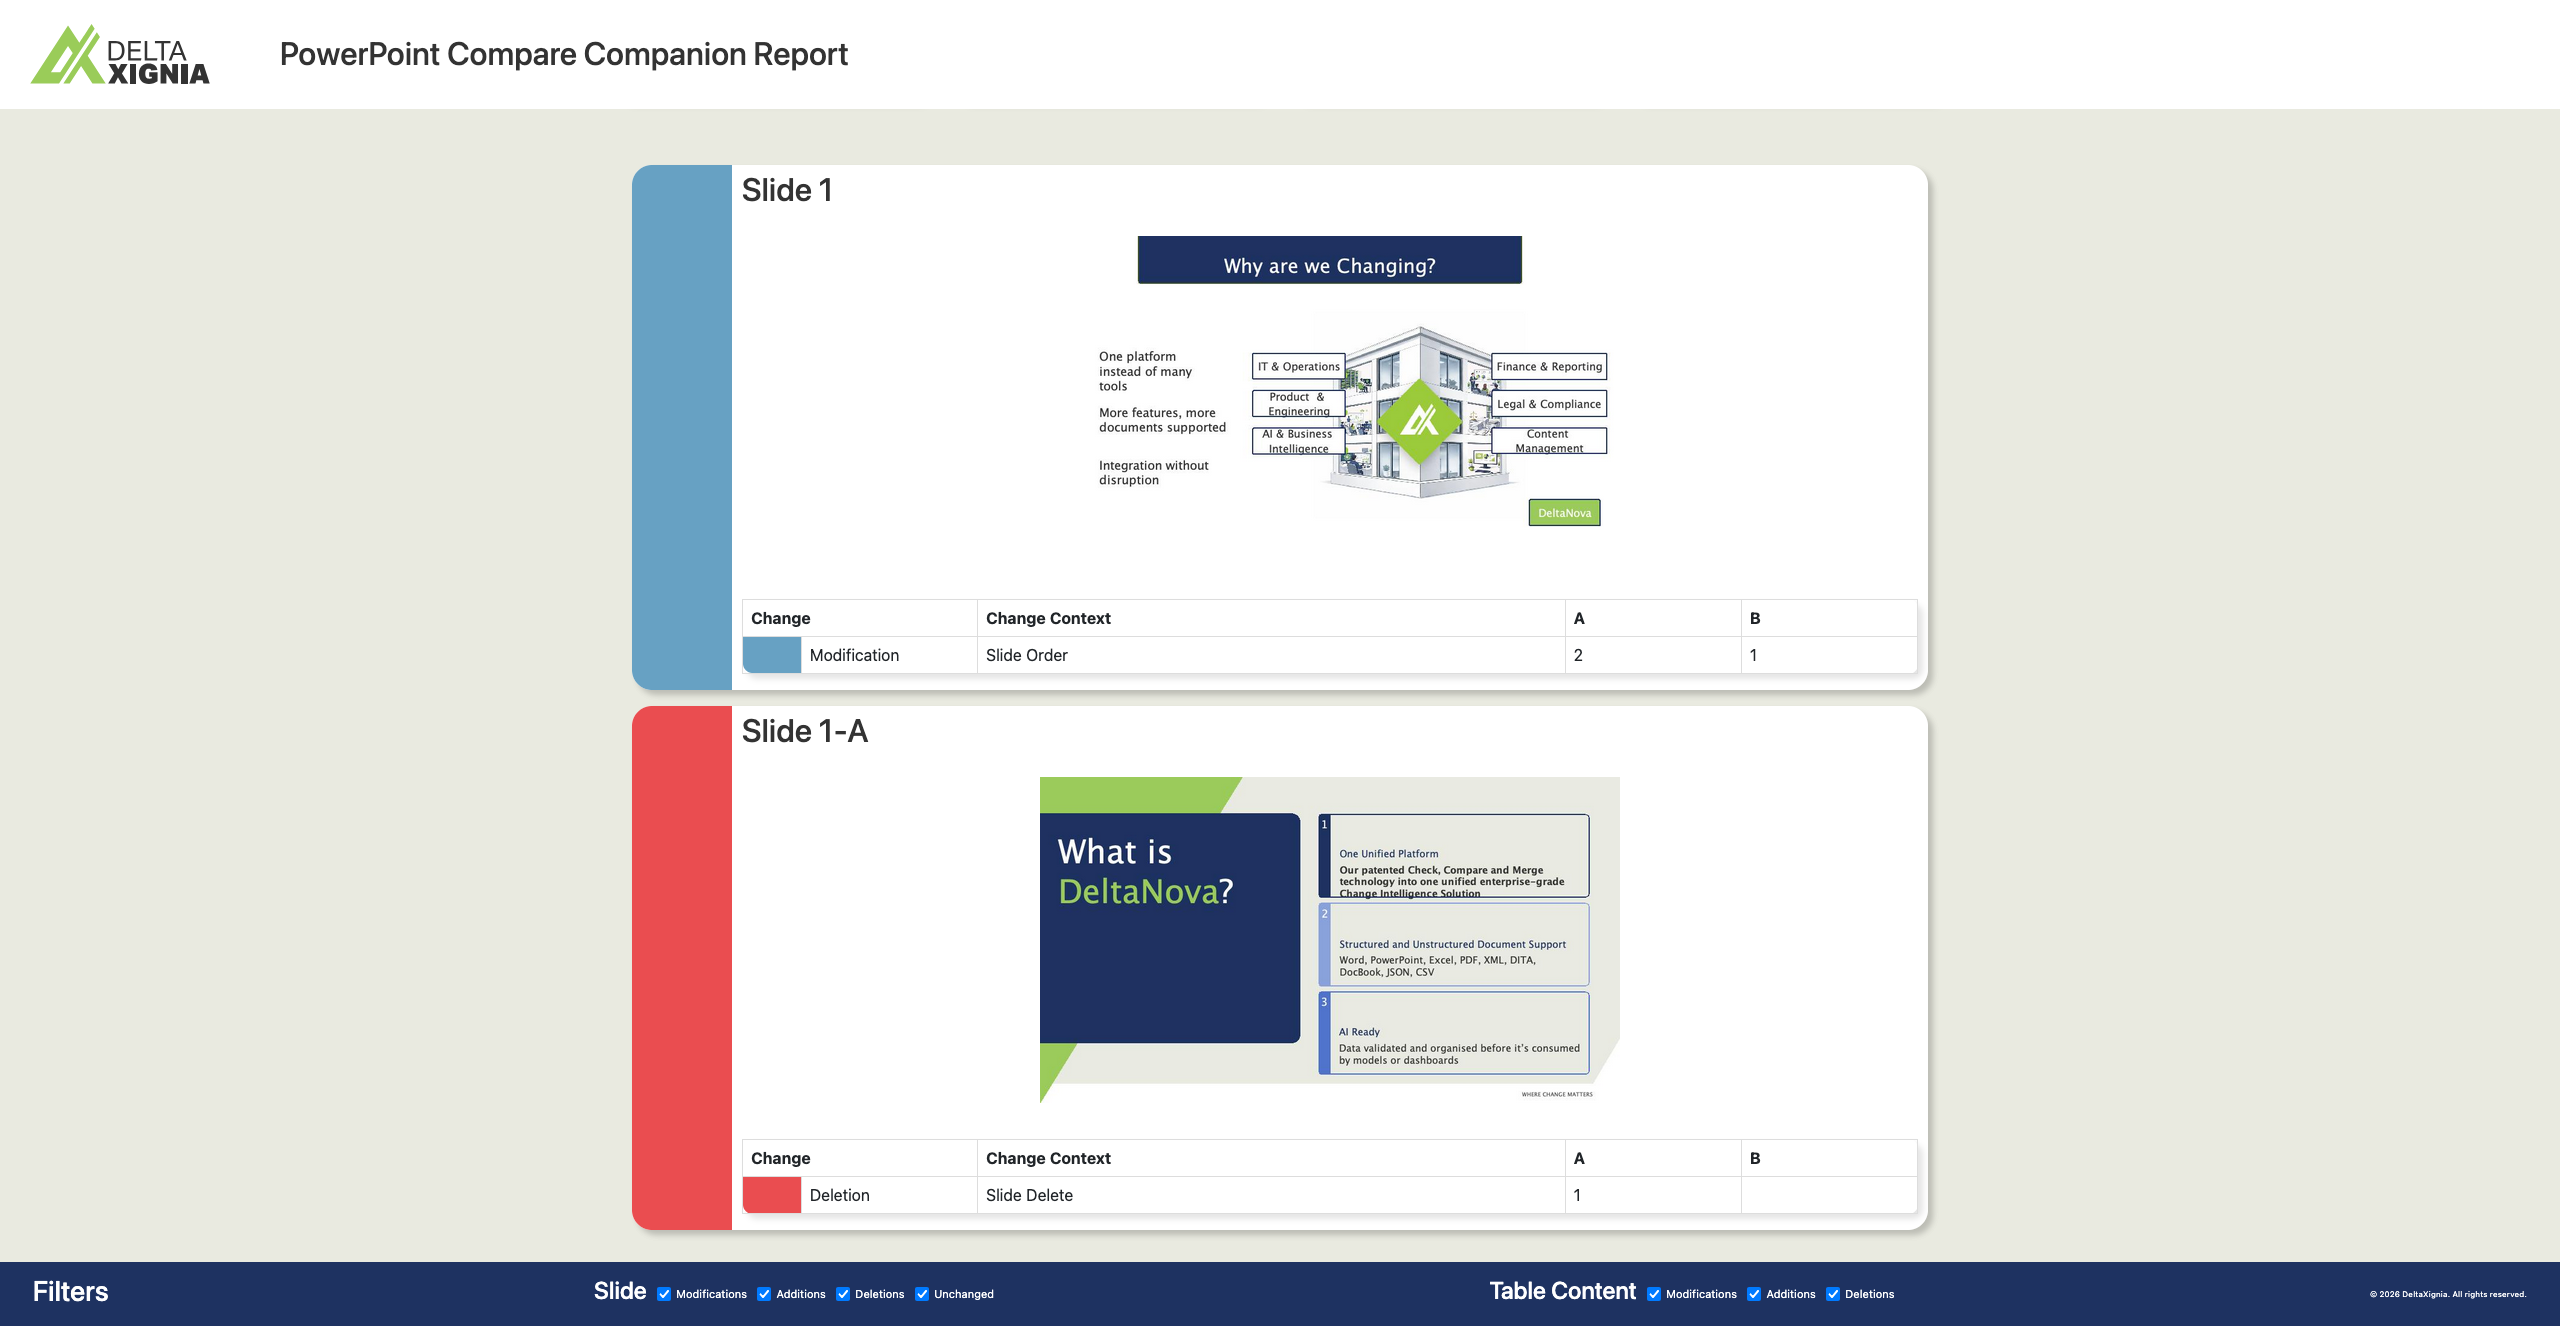
These two inputs have the second slide deleted leaving a single slide in the B input.

The result represents the deleted slide through a comment attached to the closest slides stating the position of the deleted slide, and in the report through labelling of the slide with a '-A' suffix, a red border, and the relevant Slide Delete comment. Other slides which have moved because of a deletion are also marked up with a Slide Order Modification comment.

Slide Modification
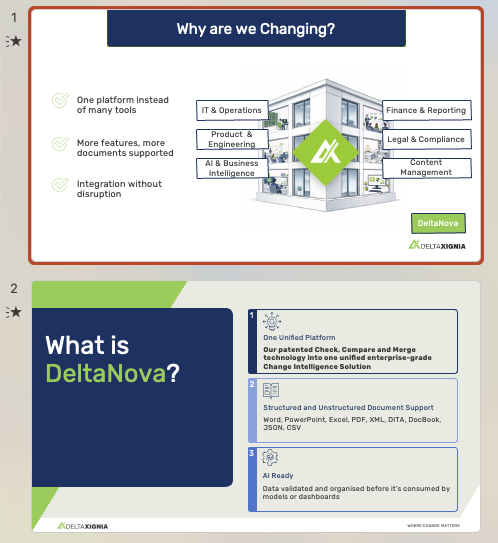
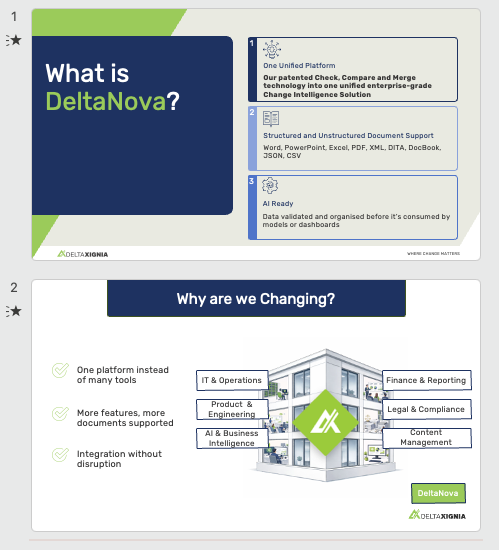
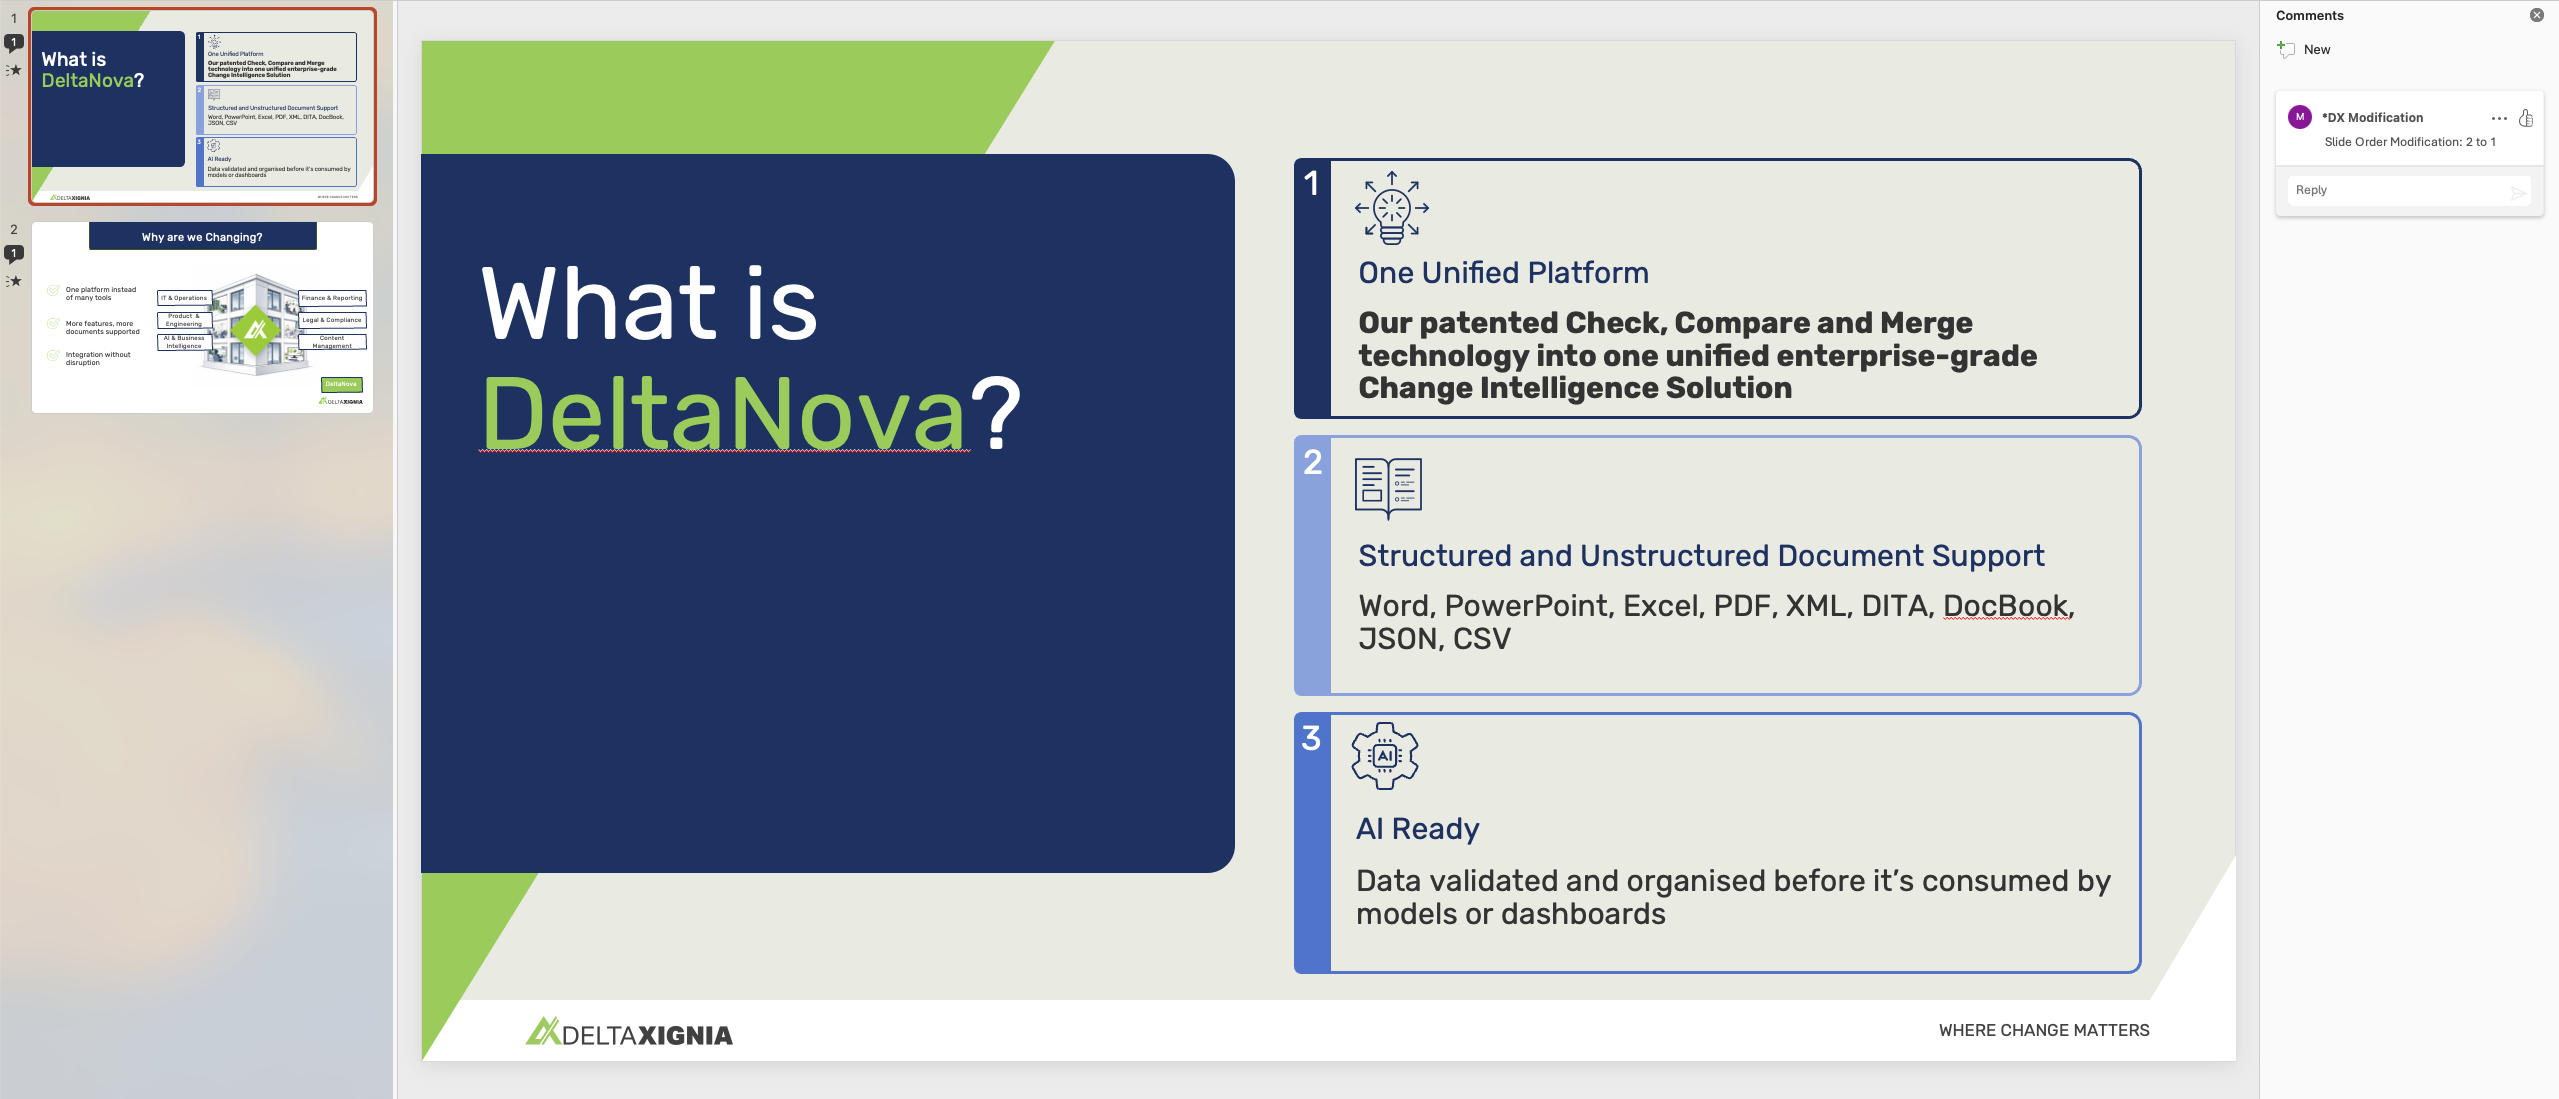
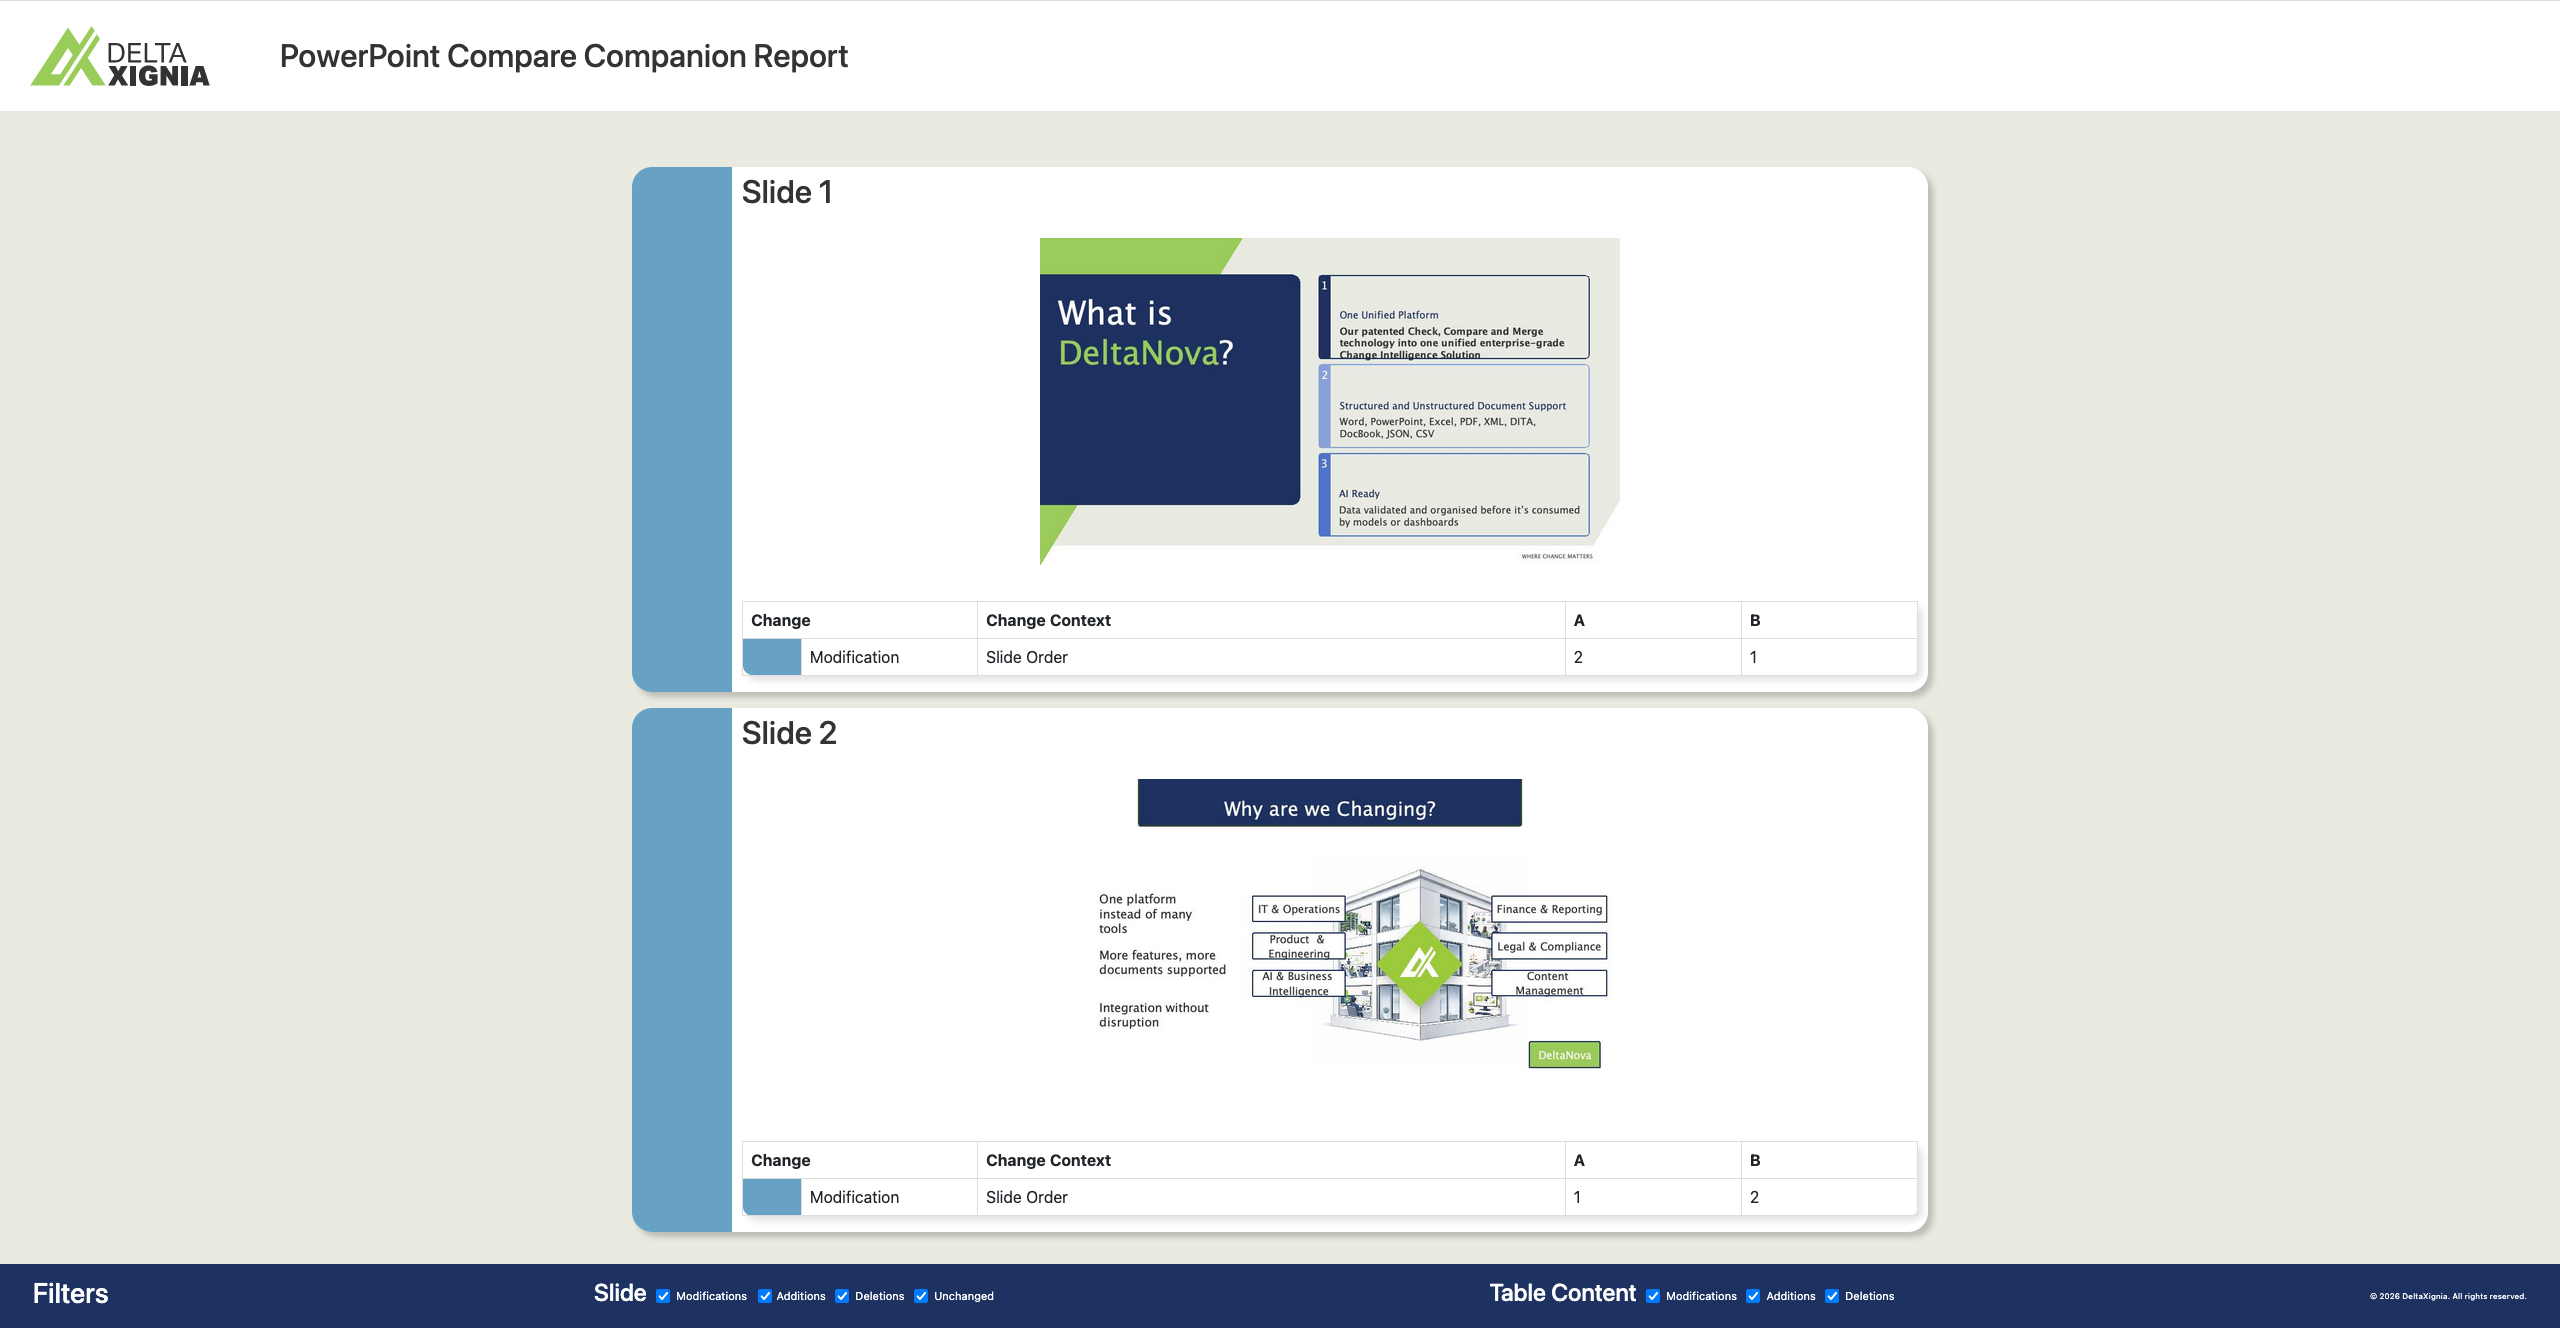
The modified slides are represented in the result with relevant comments stating a Slide Order Modification and the old and new positions. In the report the change is shown through the blue modification border and comment in the table stating the slide order change.
Supported and Unsupported Features
The scope of the PowerPoint Compare Version 1 is to compare the following parts of the document, providing an output which consists of comments on the output based on the input B version and a report.
Supported
-
Slide-Level Changes
-
Detects added slides.
-
Detects deleted slides.
-
Detects changes to slide ordering.
-
Represents slide-level differences in the comparison output.
-
-
Text Changes
-
Detects additions, deletions, and modifications within text content.
-
Covers text inside shapes, placeholders, and other text-bearing PowerPoint elements.
-
Represents textual changes through comments and/or the HTML report.
-
-
Text Formatting Changes
-
Detects changes to text styling and formatting where supported.
-
This can include changes such as font, size, bold/italic styling, colour, and other formatting
-
-
Shape Changes
-
Detects added, deleted, and modified shapes.
-
Covers common PowerPoint shape objects such as text boxes, placeholders, drawn shapes, and other slide elements.
-
Captures changes that affect the presence or structure of shapes on a slide.
-
-
Image and Icon Changes
-
Detects added, deleted, and modified images.
-
Supports comparison of visual/media elements where they are part of the slide content.
-
-
Retain existing comments
Unsupported
-
Image/media formats including - .mp4
-
Tables - Text inside will be compared but no structural changes
-
Charts
-
Animations
-
Replication is often considered addition and deletion
-
Cannot access PowerPoint through Sensitivity labels
API overview
We provide the following ways to use PowerPoint Compare.
Future Enhancement Considerations
-
Structural table comparison
-
Handling of change representation for further elements including:
-
Charts
-
Animations
-
Video
-