How to Use DeltaNova PowerPoint Comparison
This section explains how to use DeltaNova PowerPoint Compare, so you can better understand your comparison result and better navigate your result. There are also change result examples you can refer to.
Viewing Changes Within the PowerPoint Result
Microsoft PowerPoint removed its Compare and Merge functions from Microsoft Office 365. To provide a valid Microsoft PowerPoint presentation output, DeltaNova PowerPoint Compare uses the Comments feature that remains. This section describes how to view the changes within the PowerPoint result.
-
Open a result presentation in Microsoft PowerPoint.
-
Select the Home tab.
-
Select Arrange > Selection Pane. The Selection Pane appears, listing the shapes on the slide. At this point, you can perform any of the following actions.
-
View the shape names.
-
Change the shape names.
-
View comments about the change.
-
View the HTML report containing information about the change.
-
Follow links to the respective changed content within the slide.



The names of the renamed shapes appear in the report, which can help with quick identification of the changed parts when combined with the rendered slides above the table, or the PowerPoint result itself.

Change Result Examples
Text
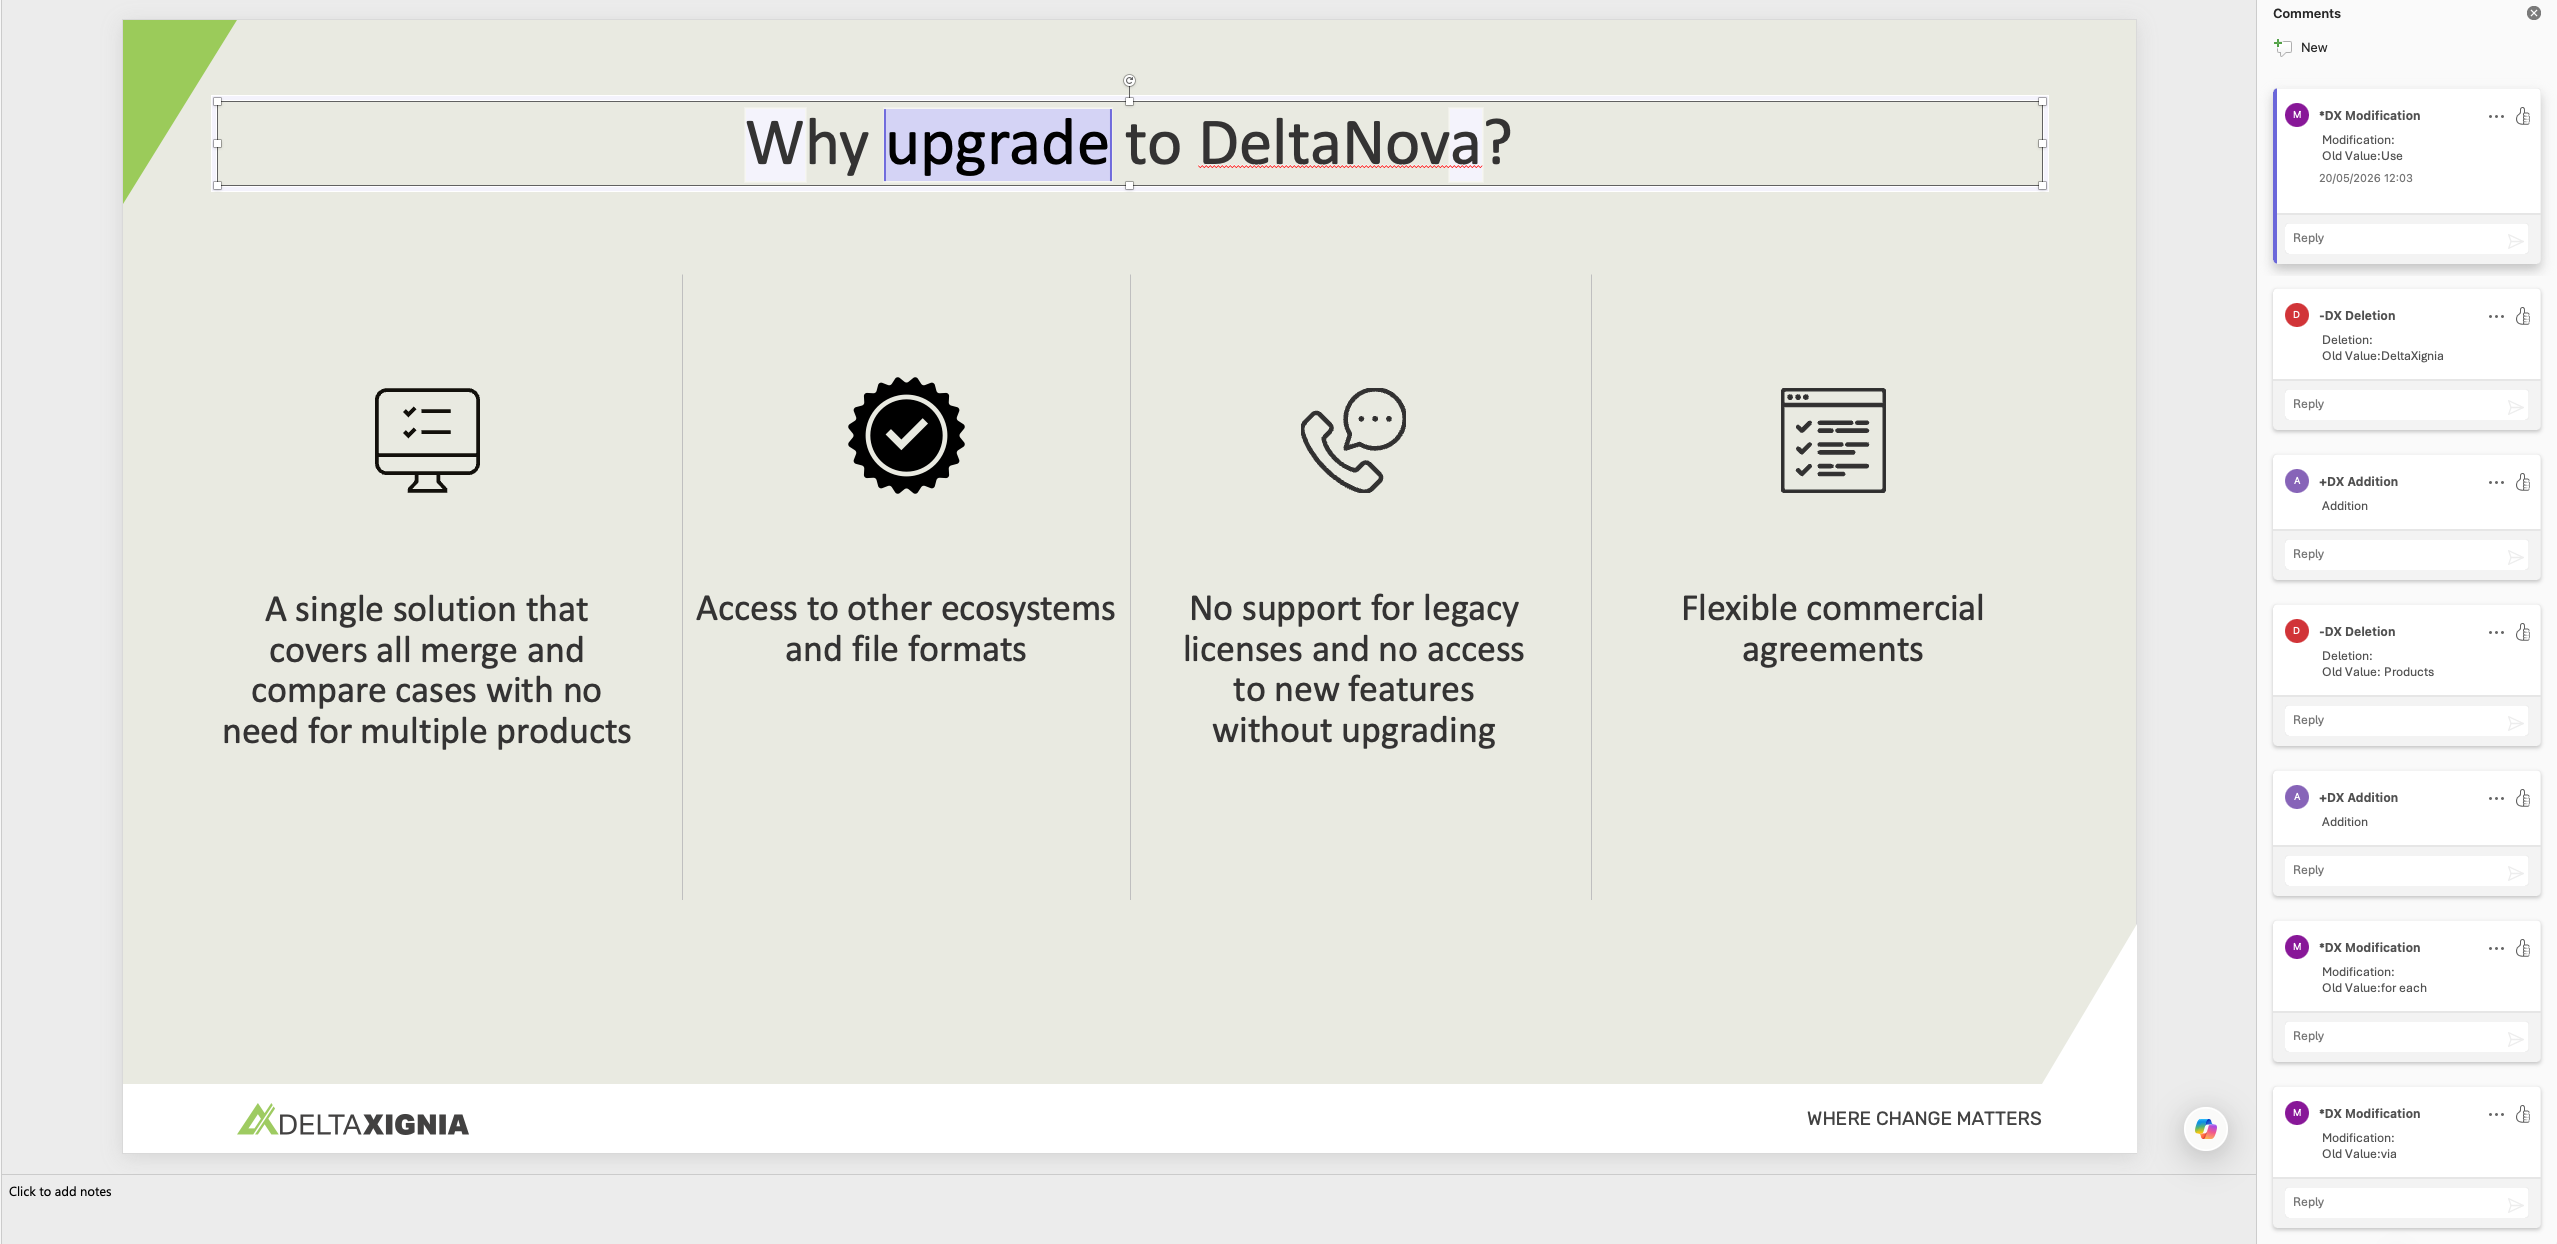
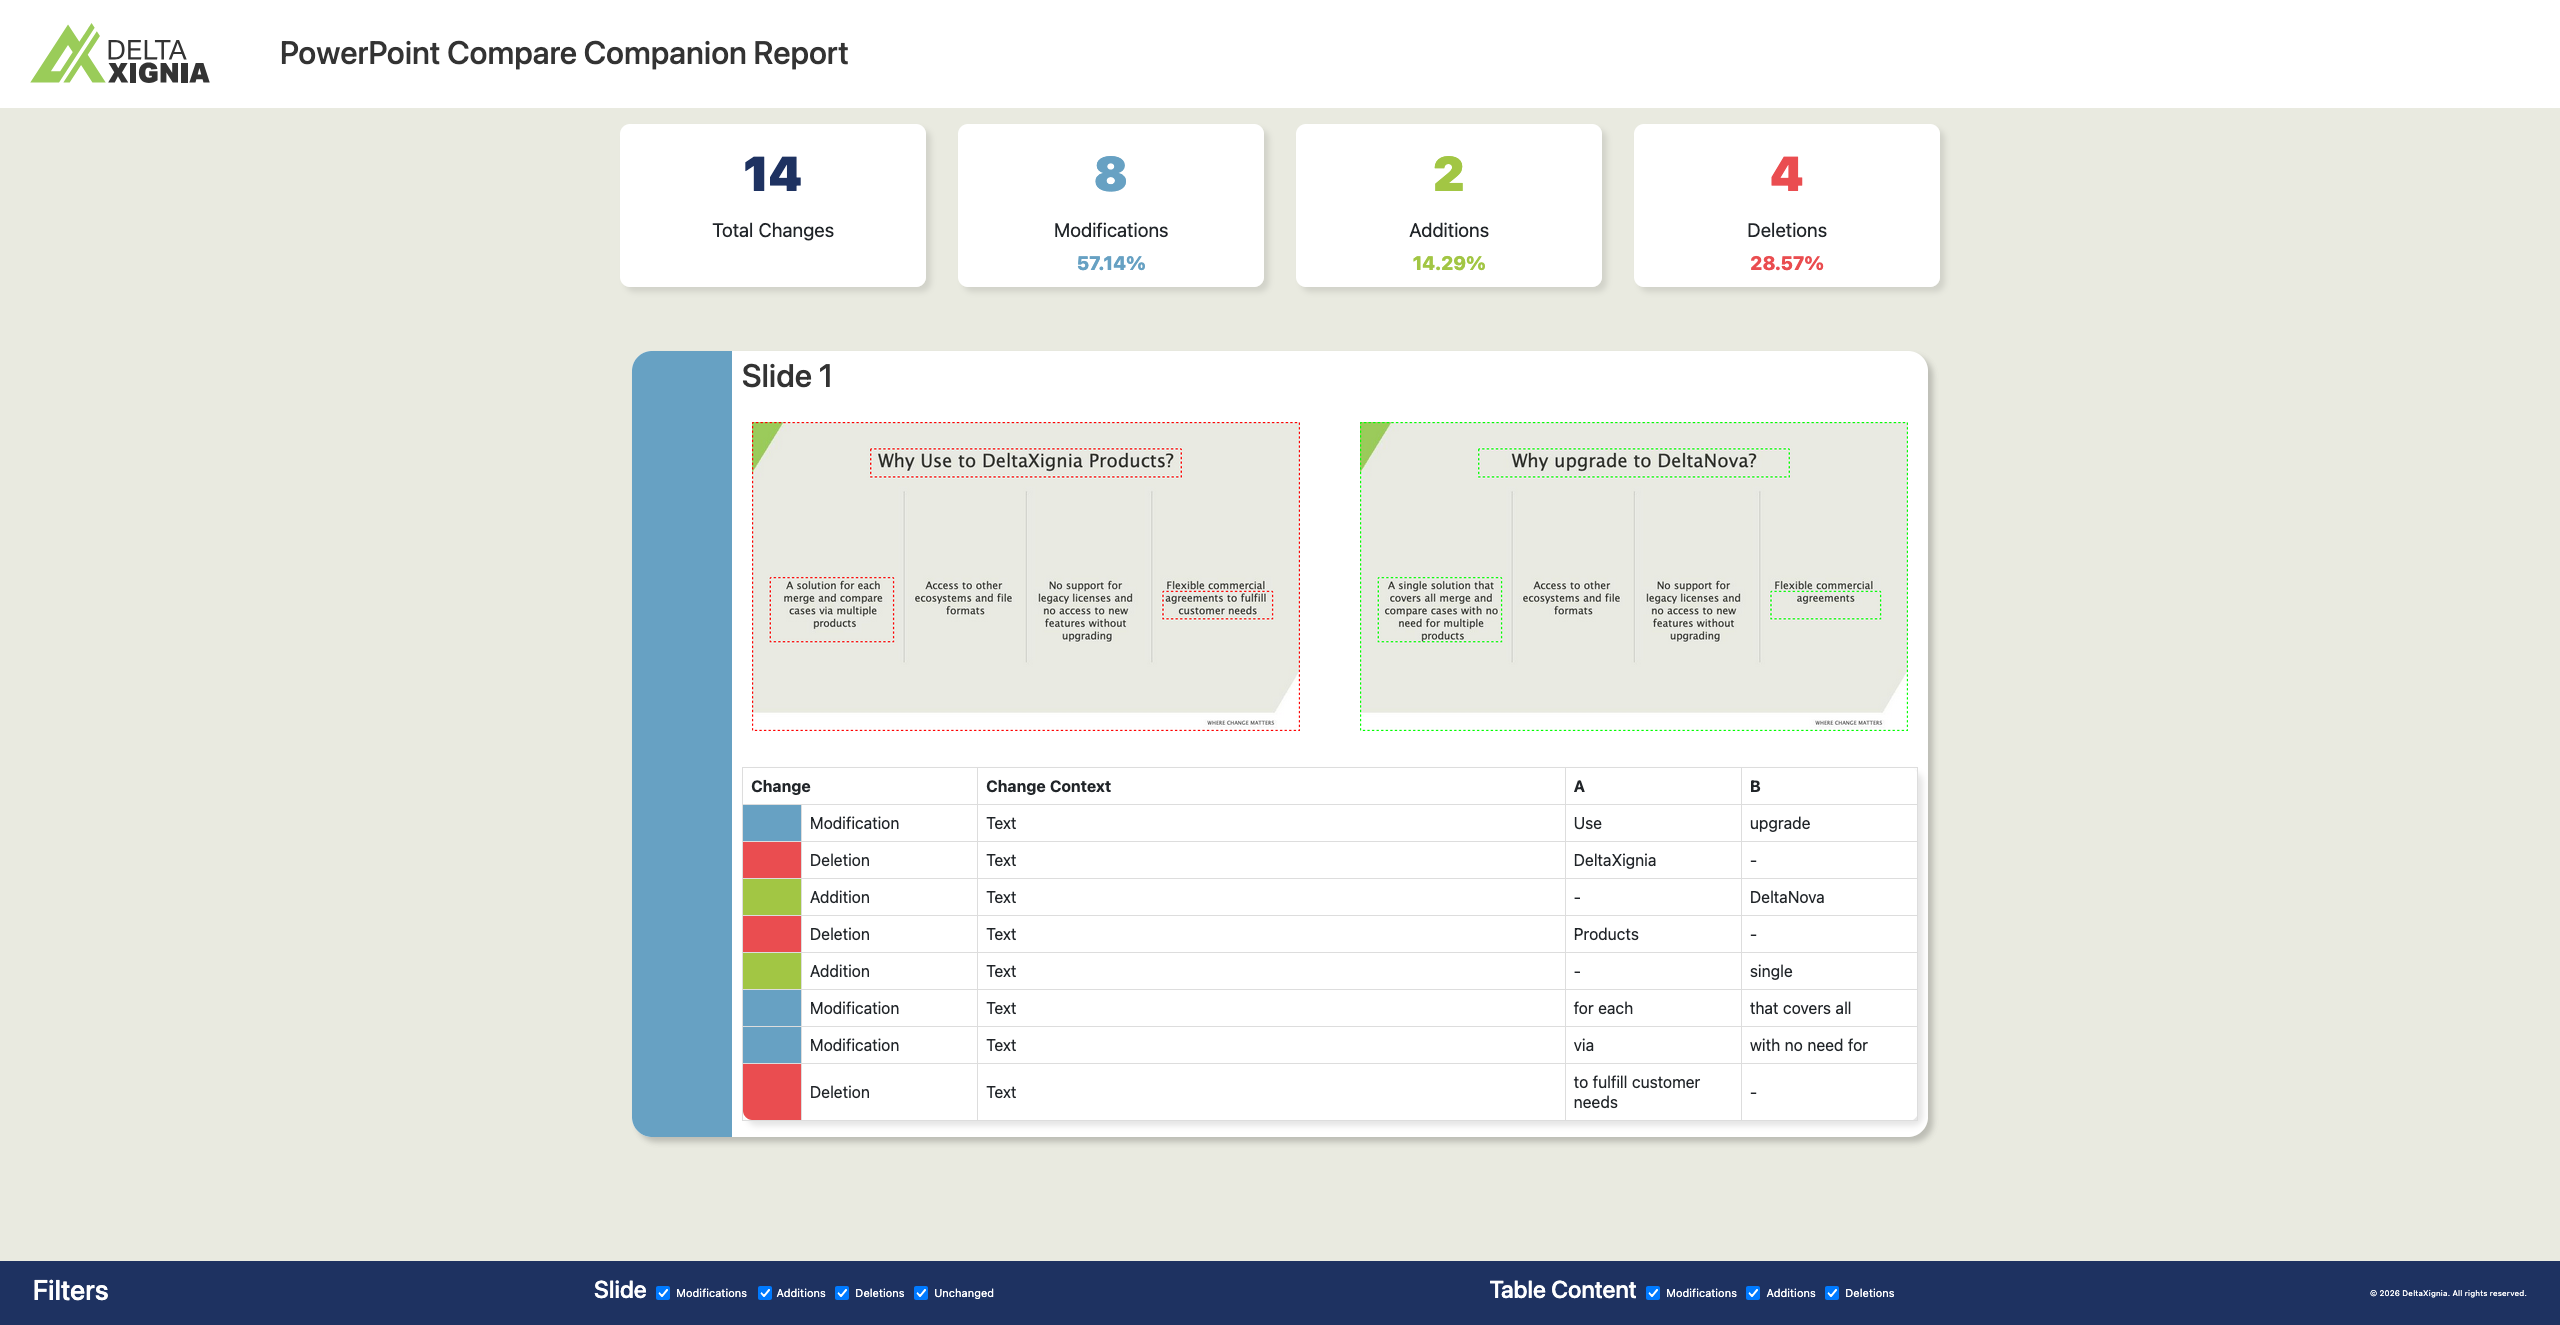
The two inputs show a slides with a variety of text changes applied, including additions, deletion, and modifications.


The changes are shown in the resulting Microsoft PowerPoint file as comments, with each comment highlighting the corresponding text change when you select it. In the report, the same comments appear in a table, below the renderings of the two slides with boxes highlighting change.
Shapes Addition, Deletion, Modification
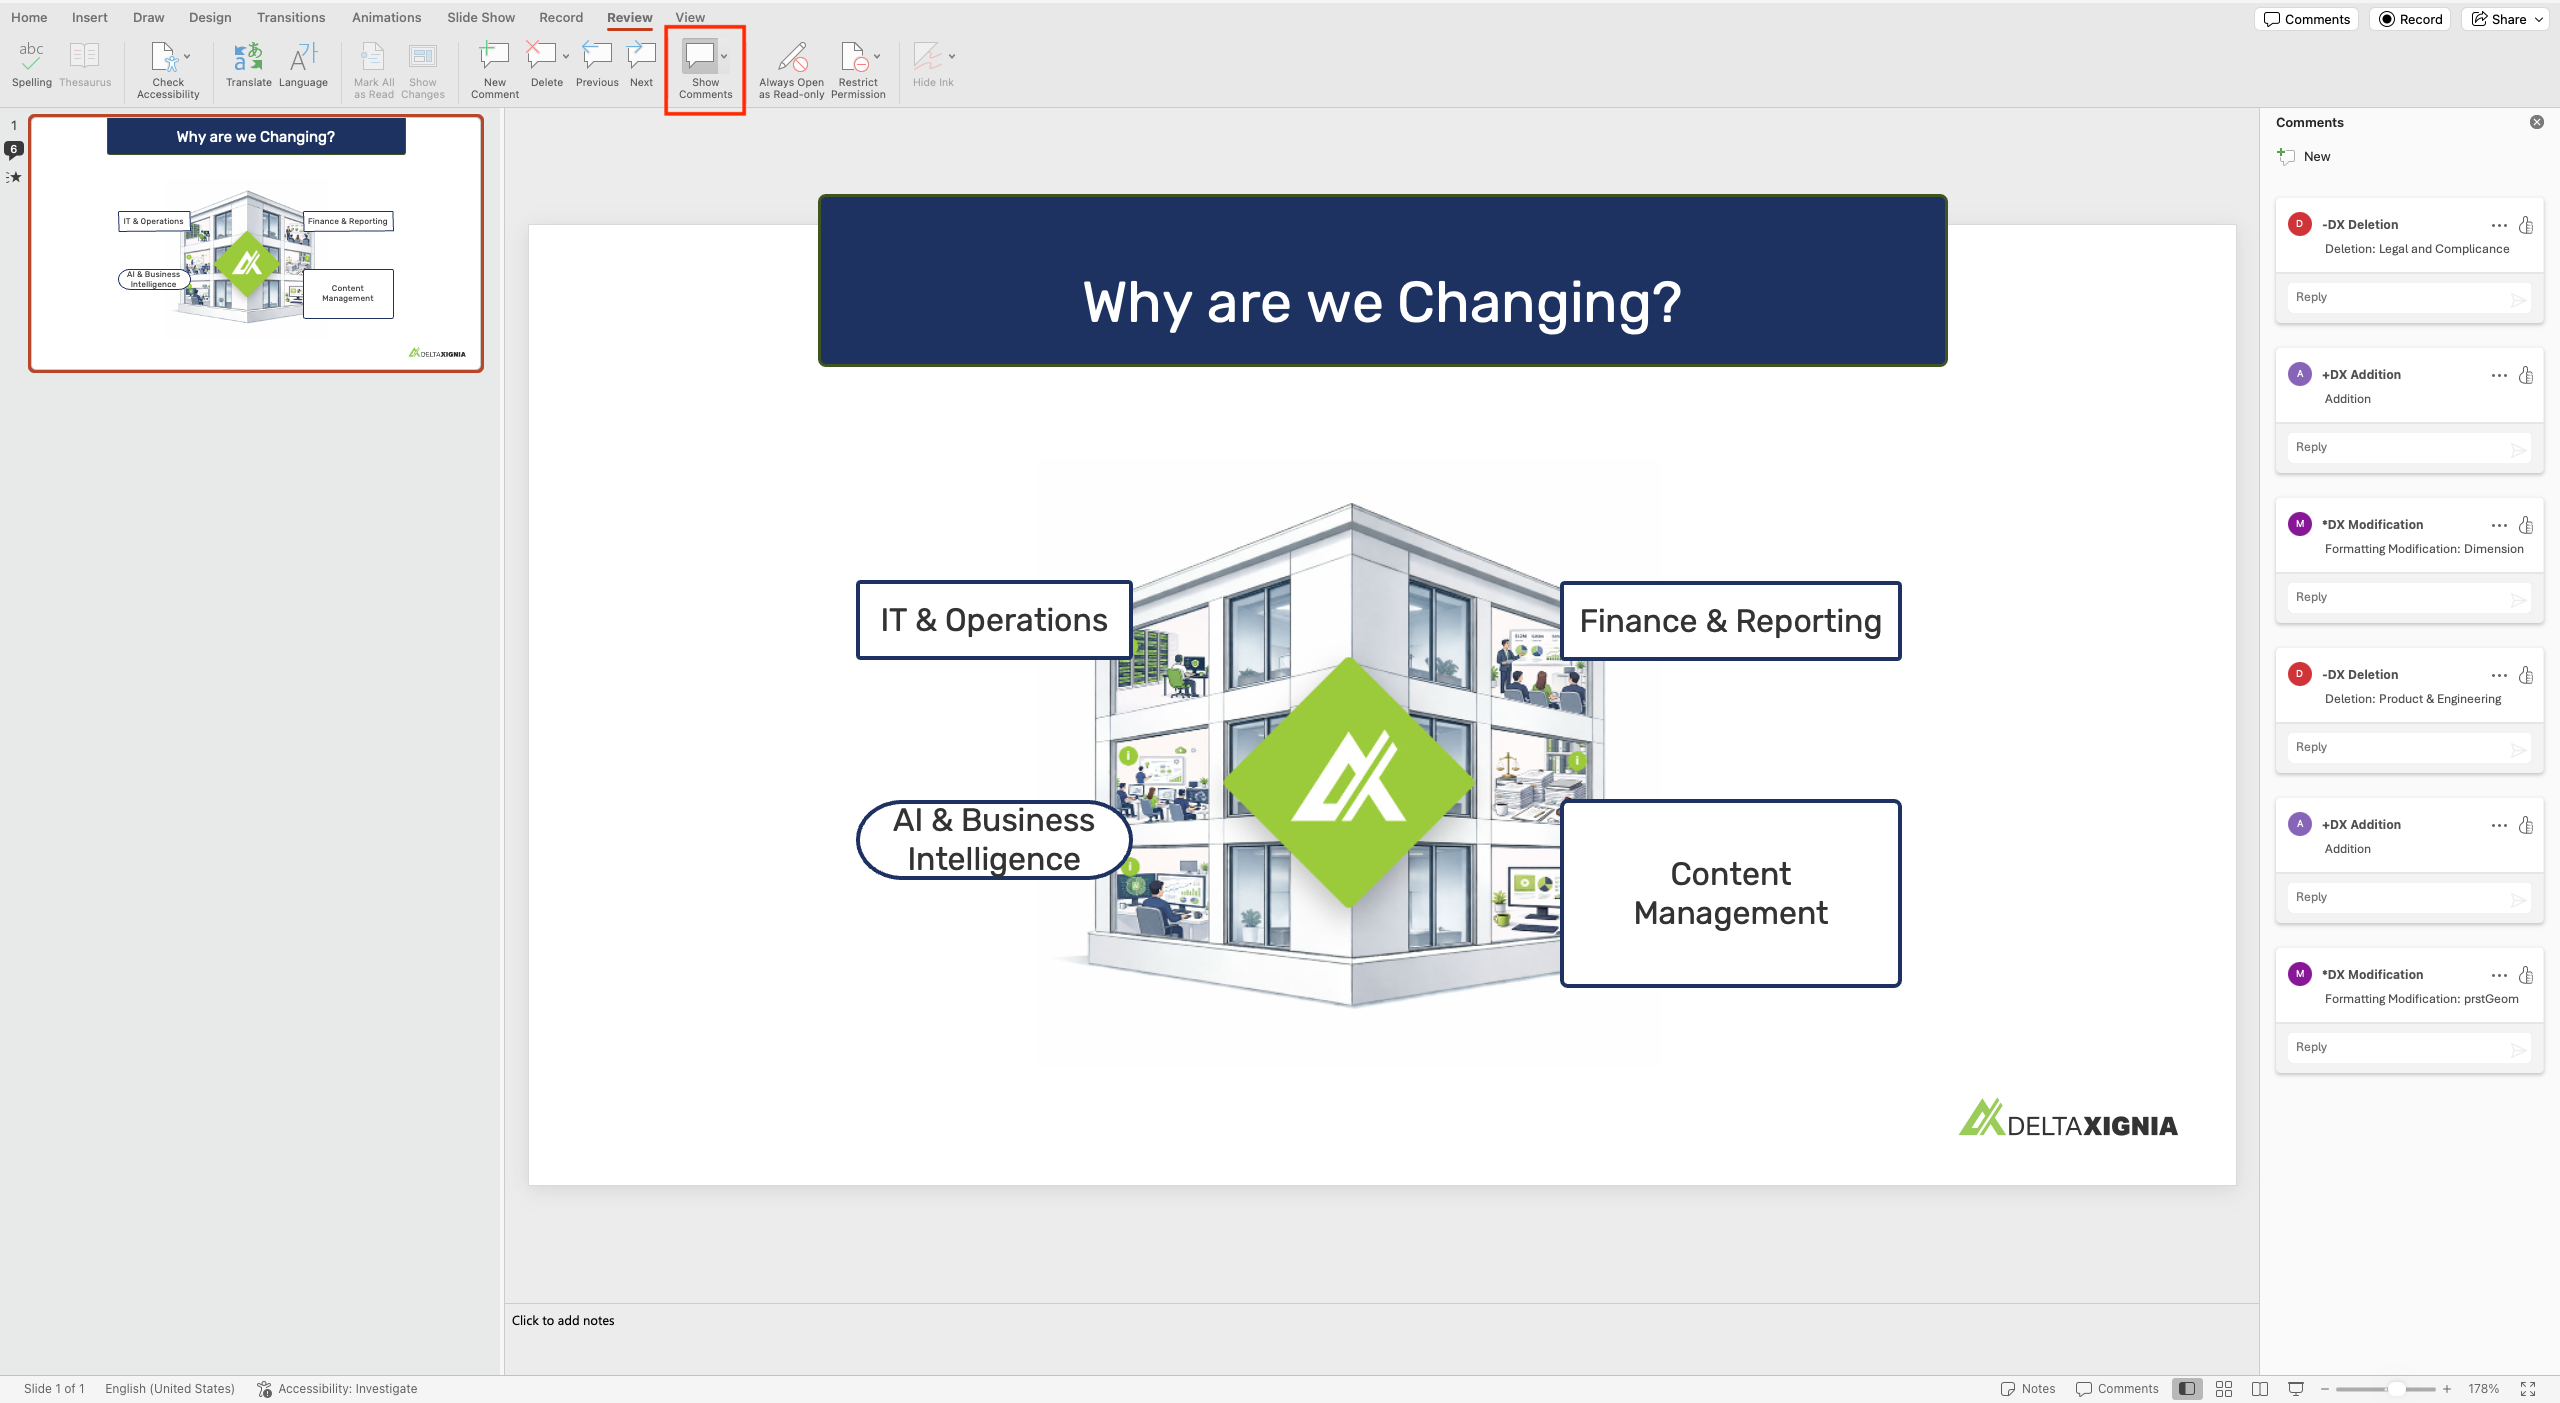
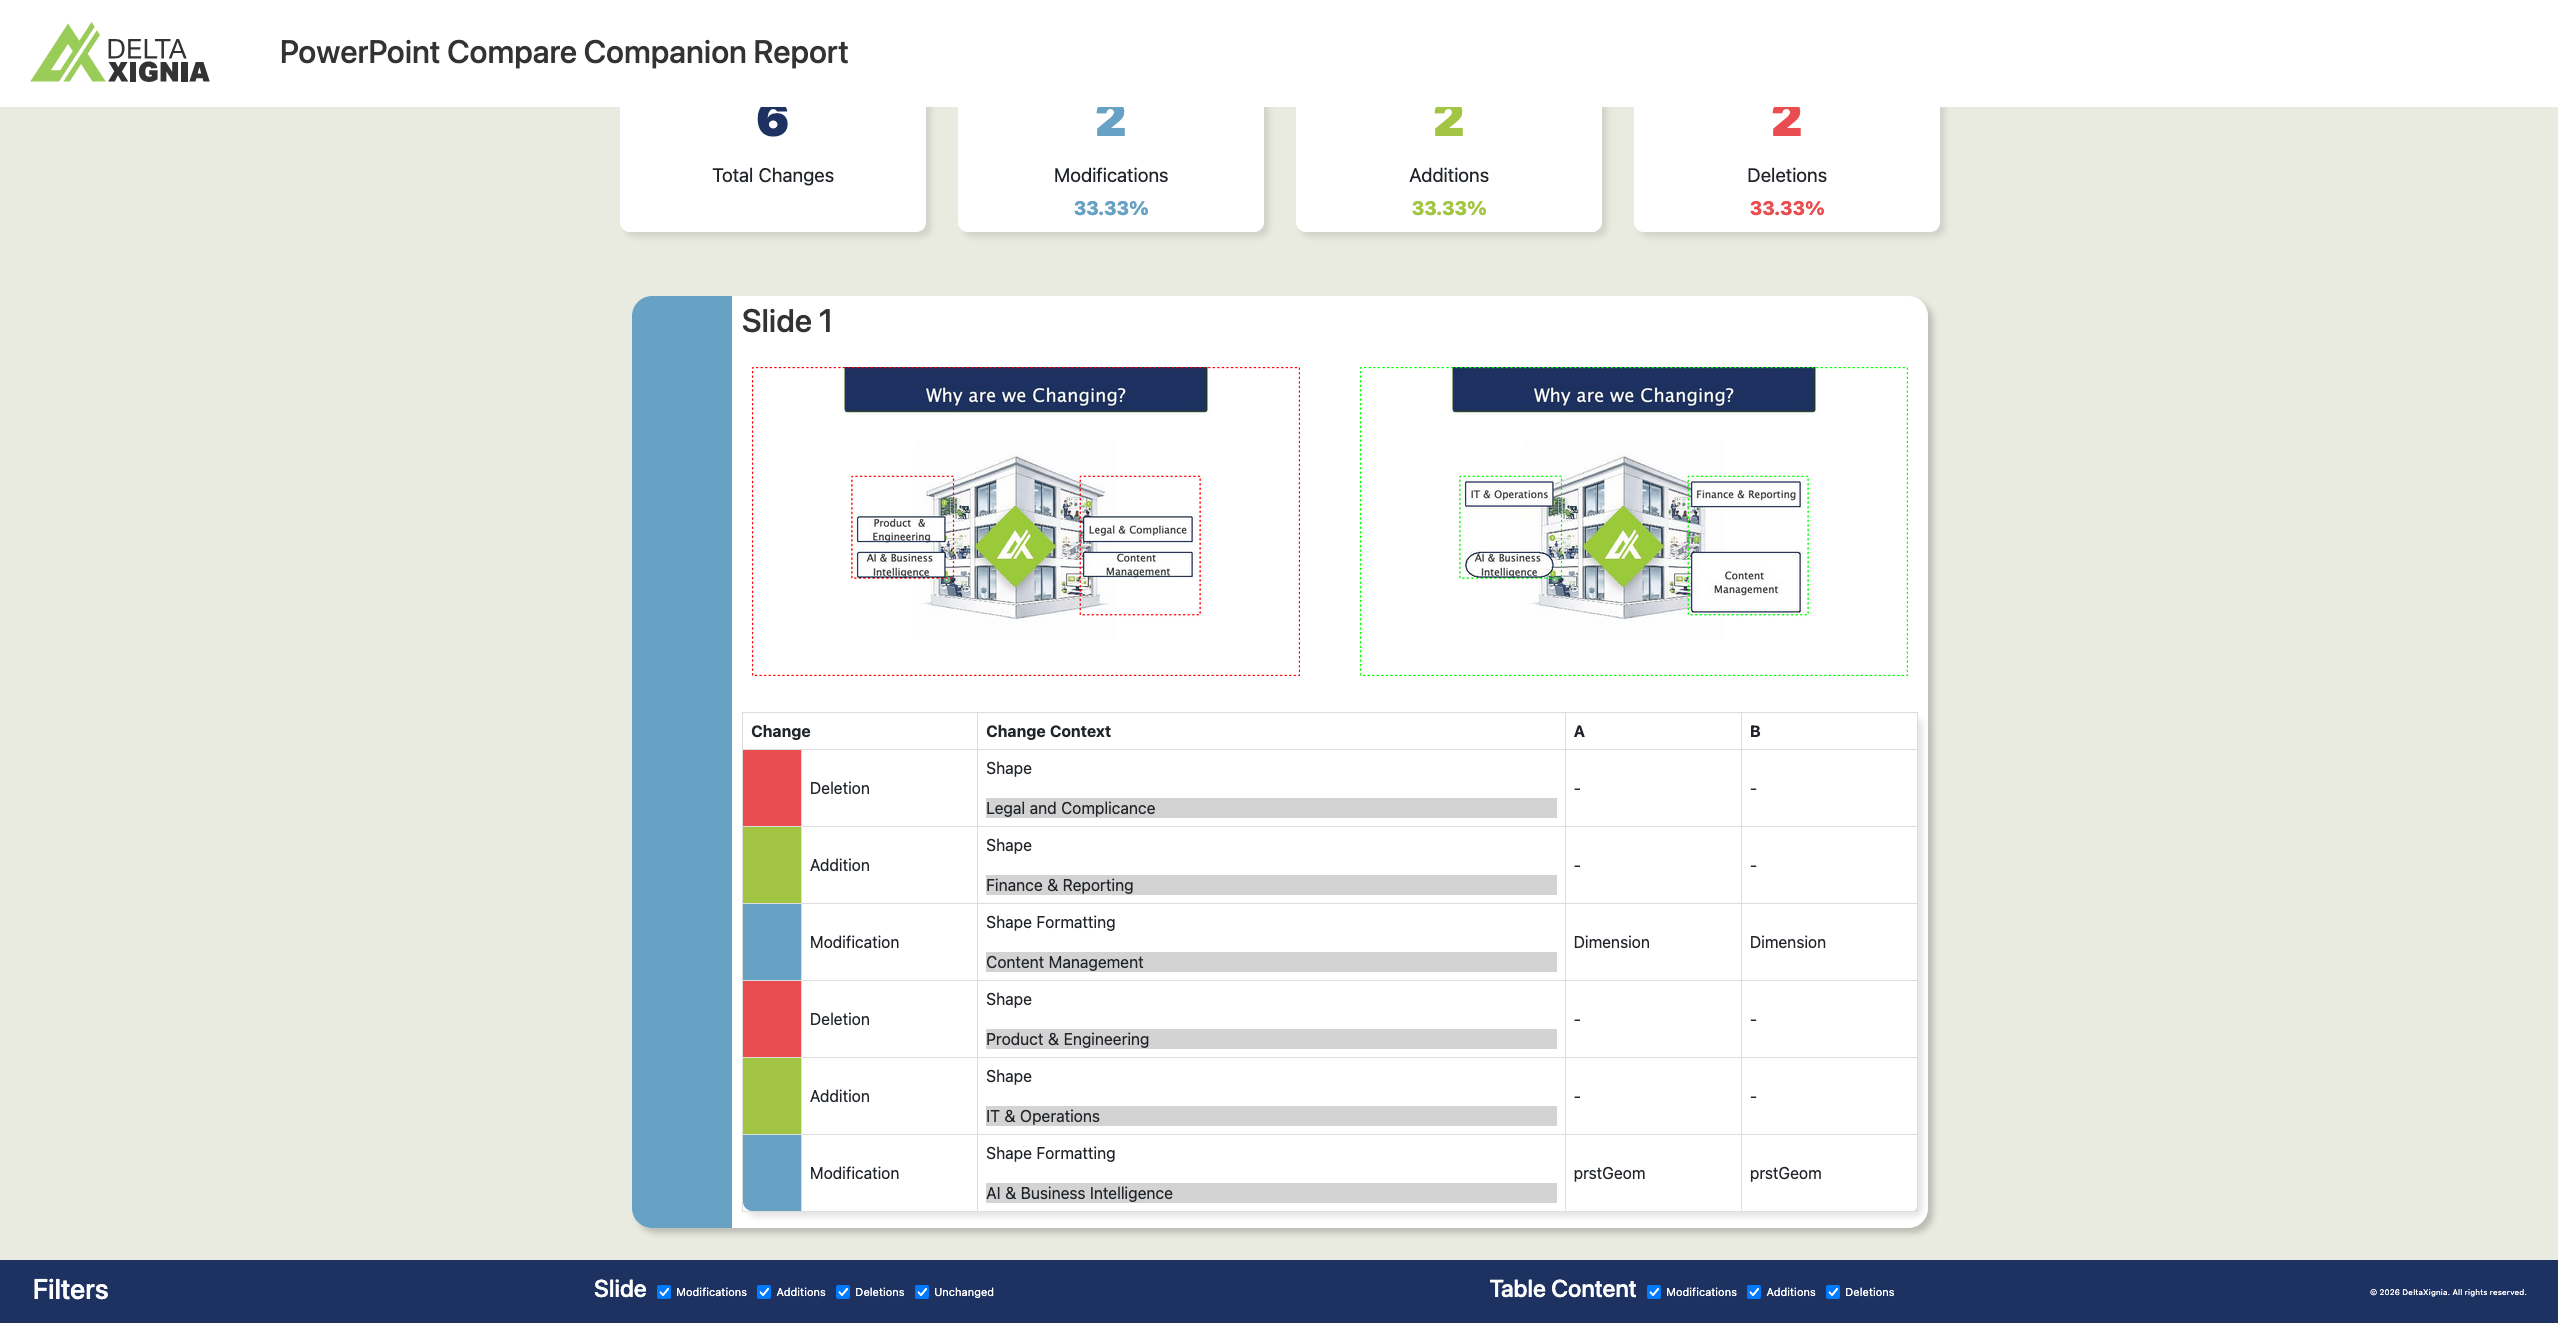
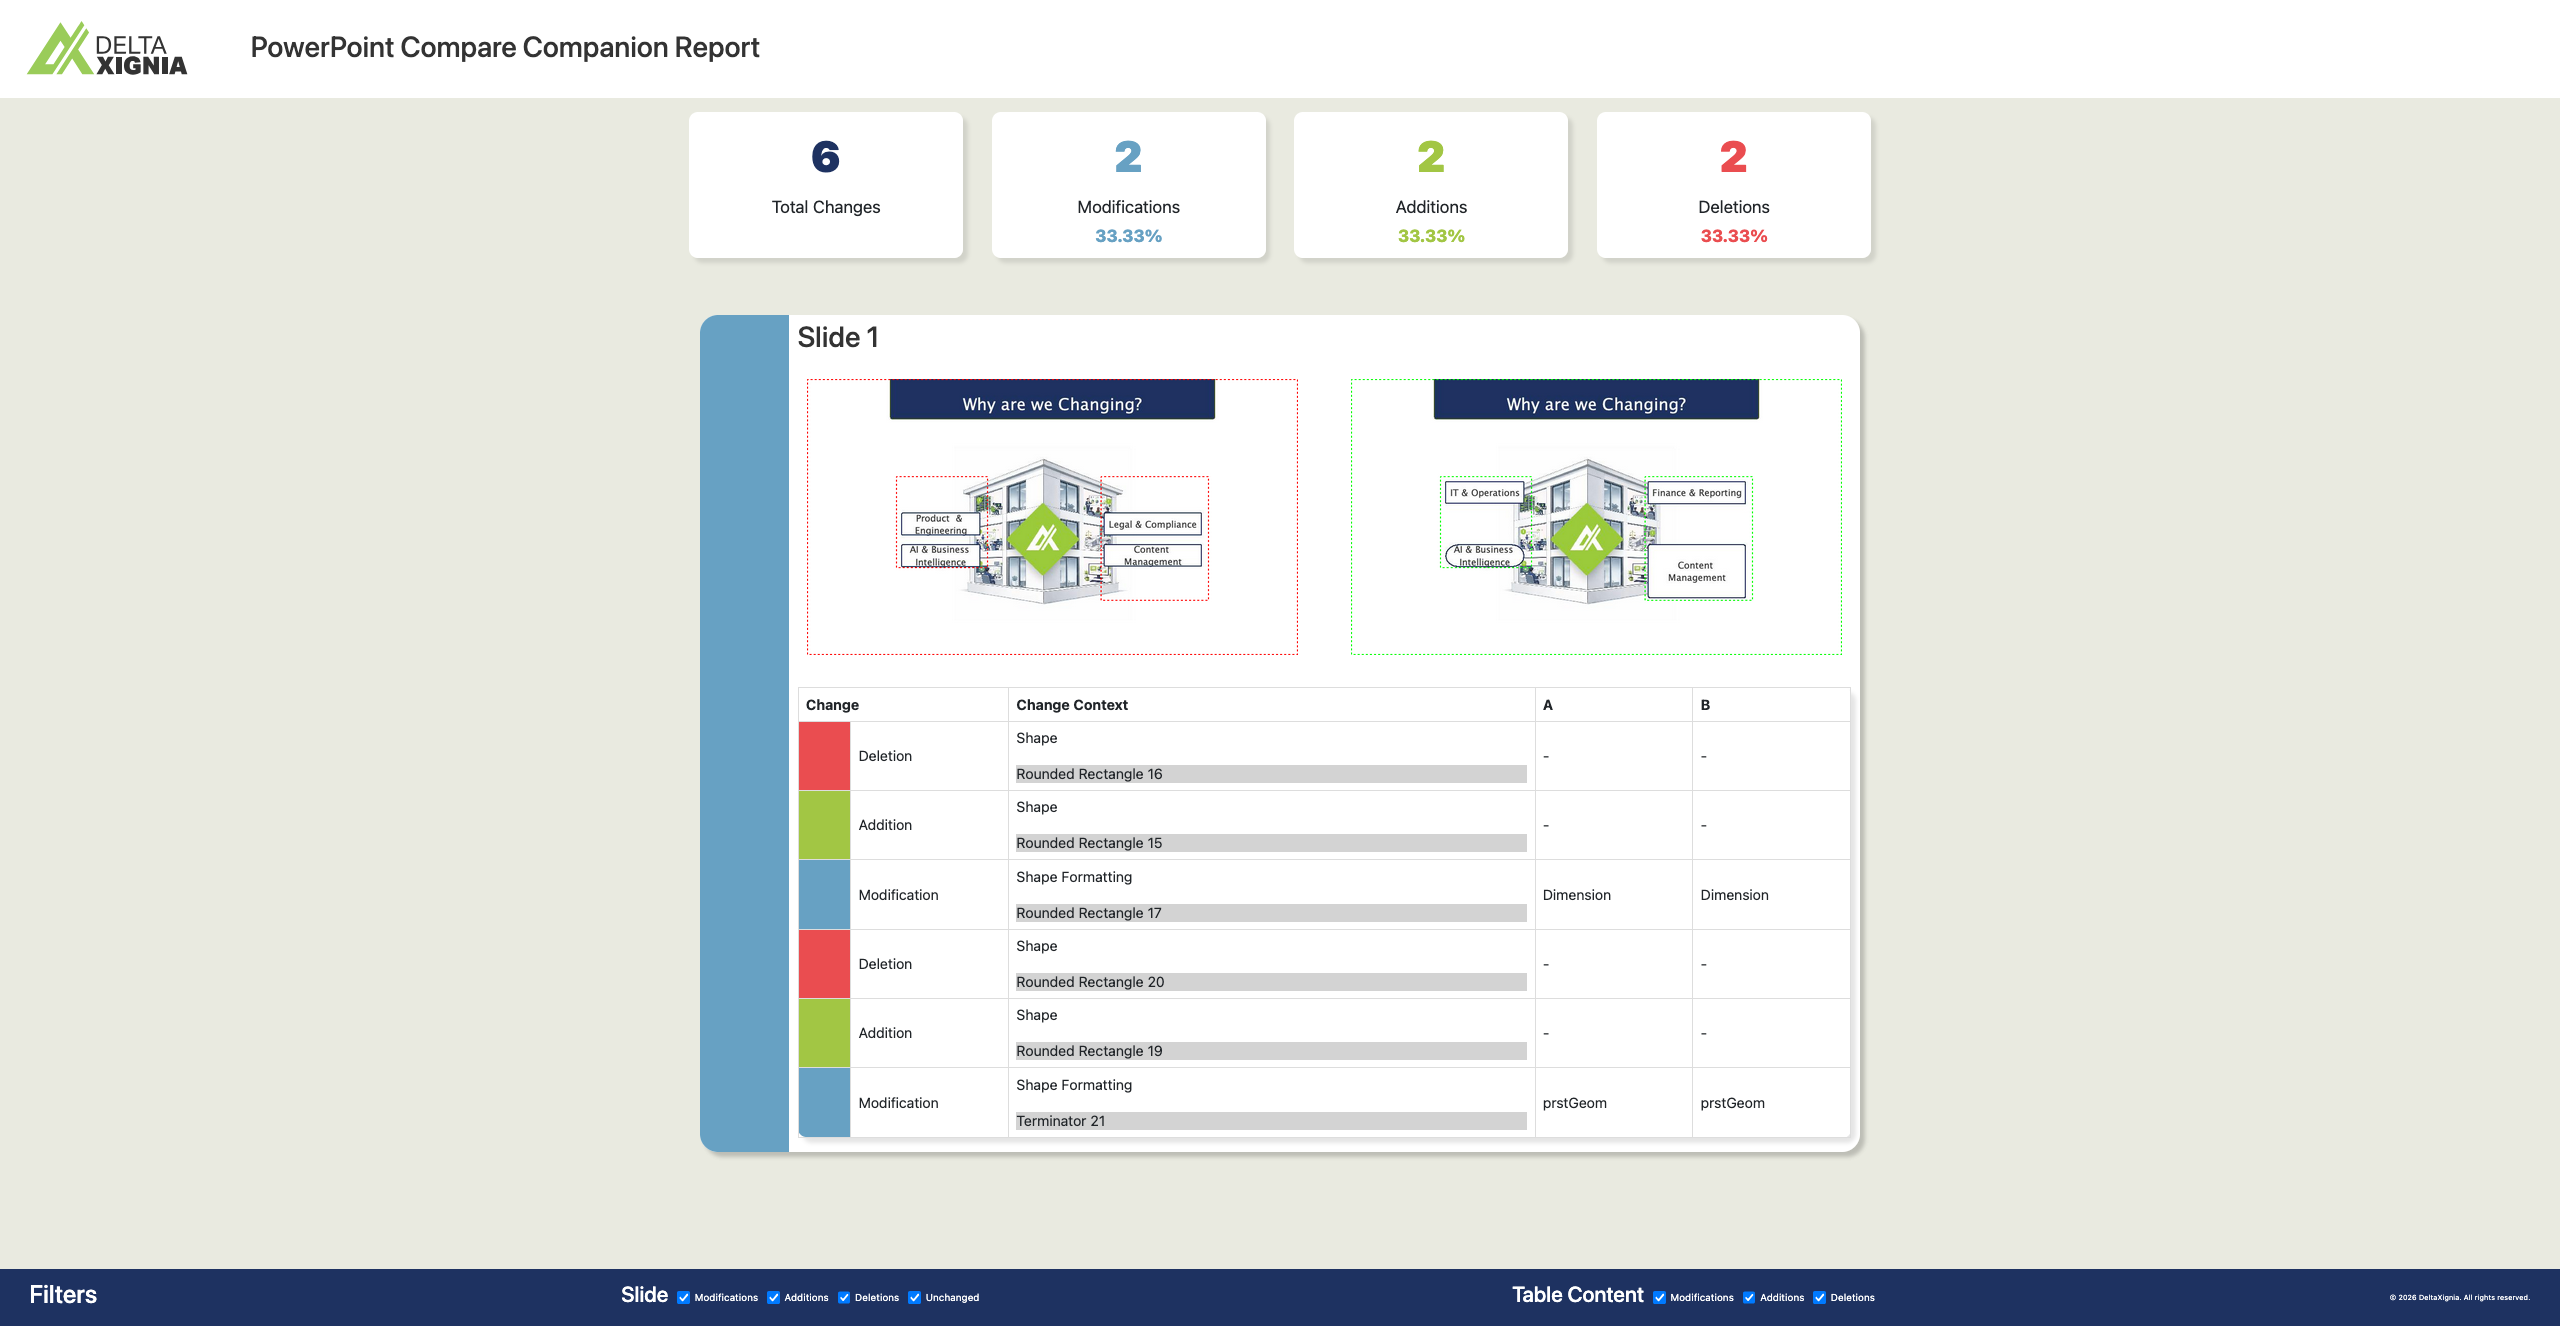
The two inputs show slides with shapes that have been added, deleted and modified.


In the PowerPoint result the changes to the shapes are identified with comments which highlight the relevant shape when selected. In the report the changes are identified in the table for the slide and highlighted via bounding boxes in the slide rendering

Images Modification
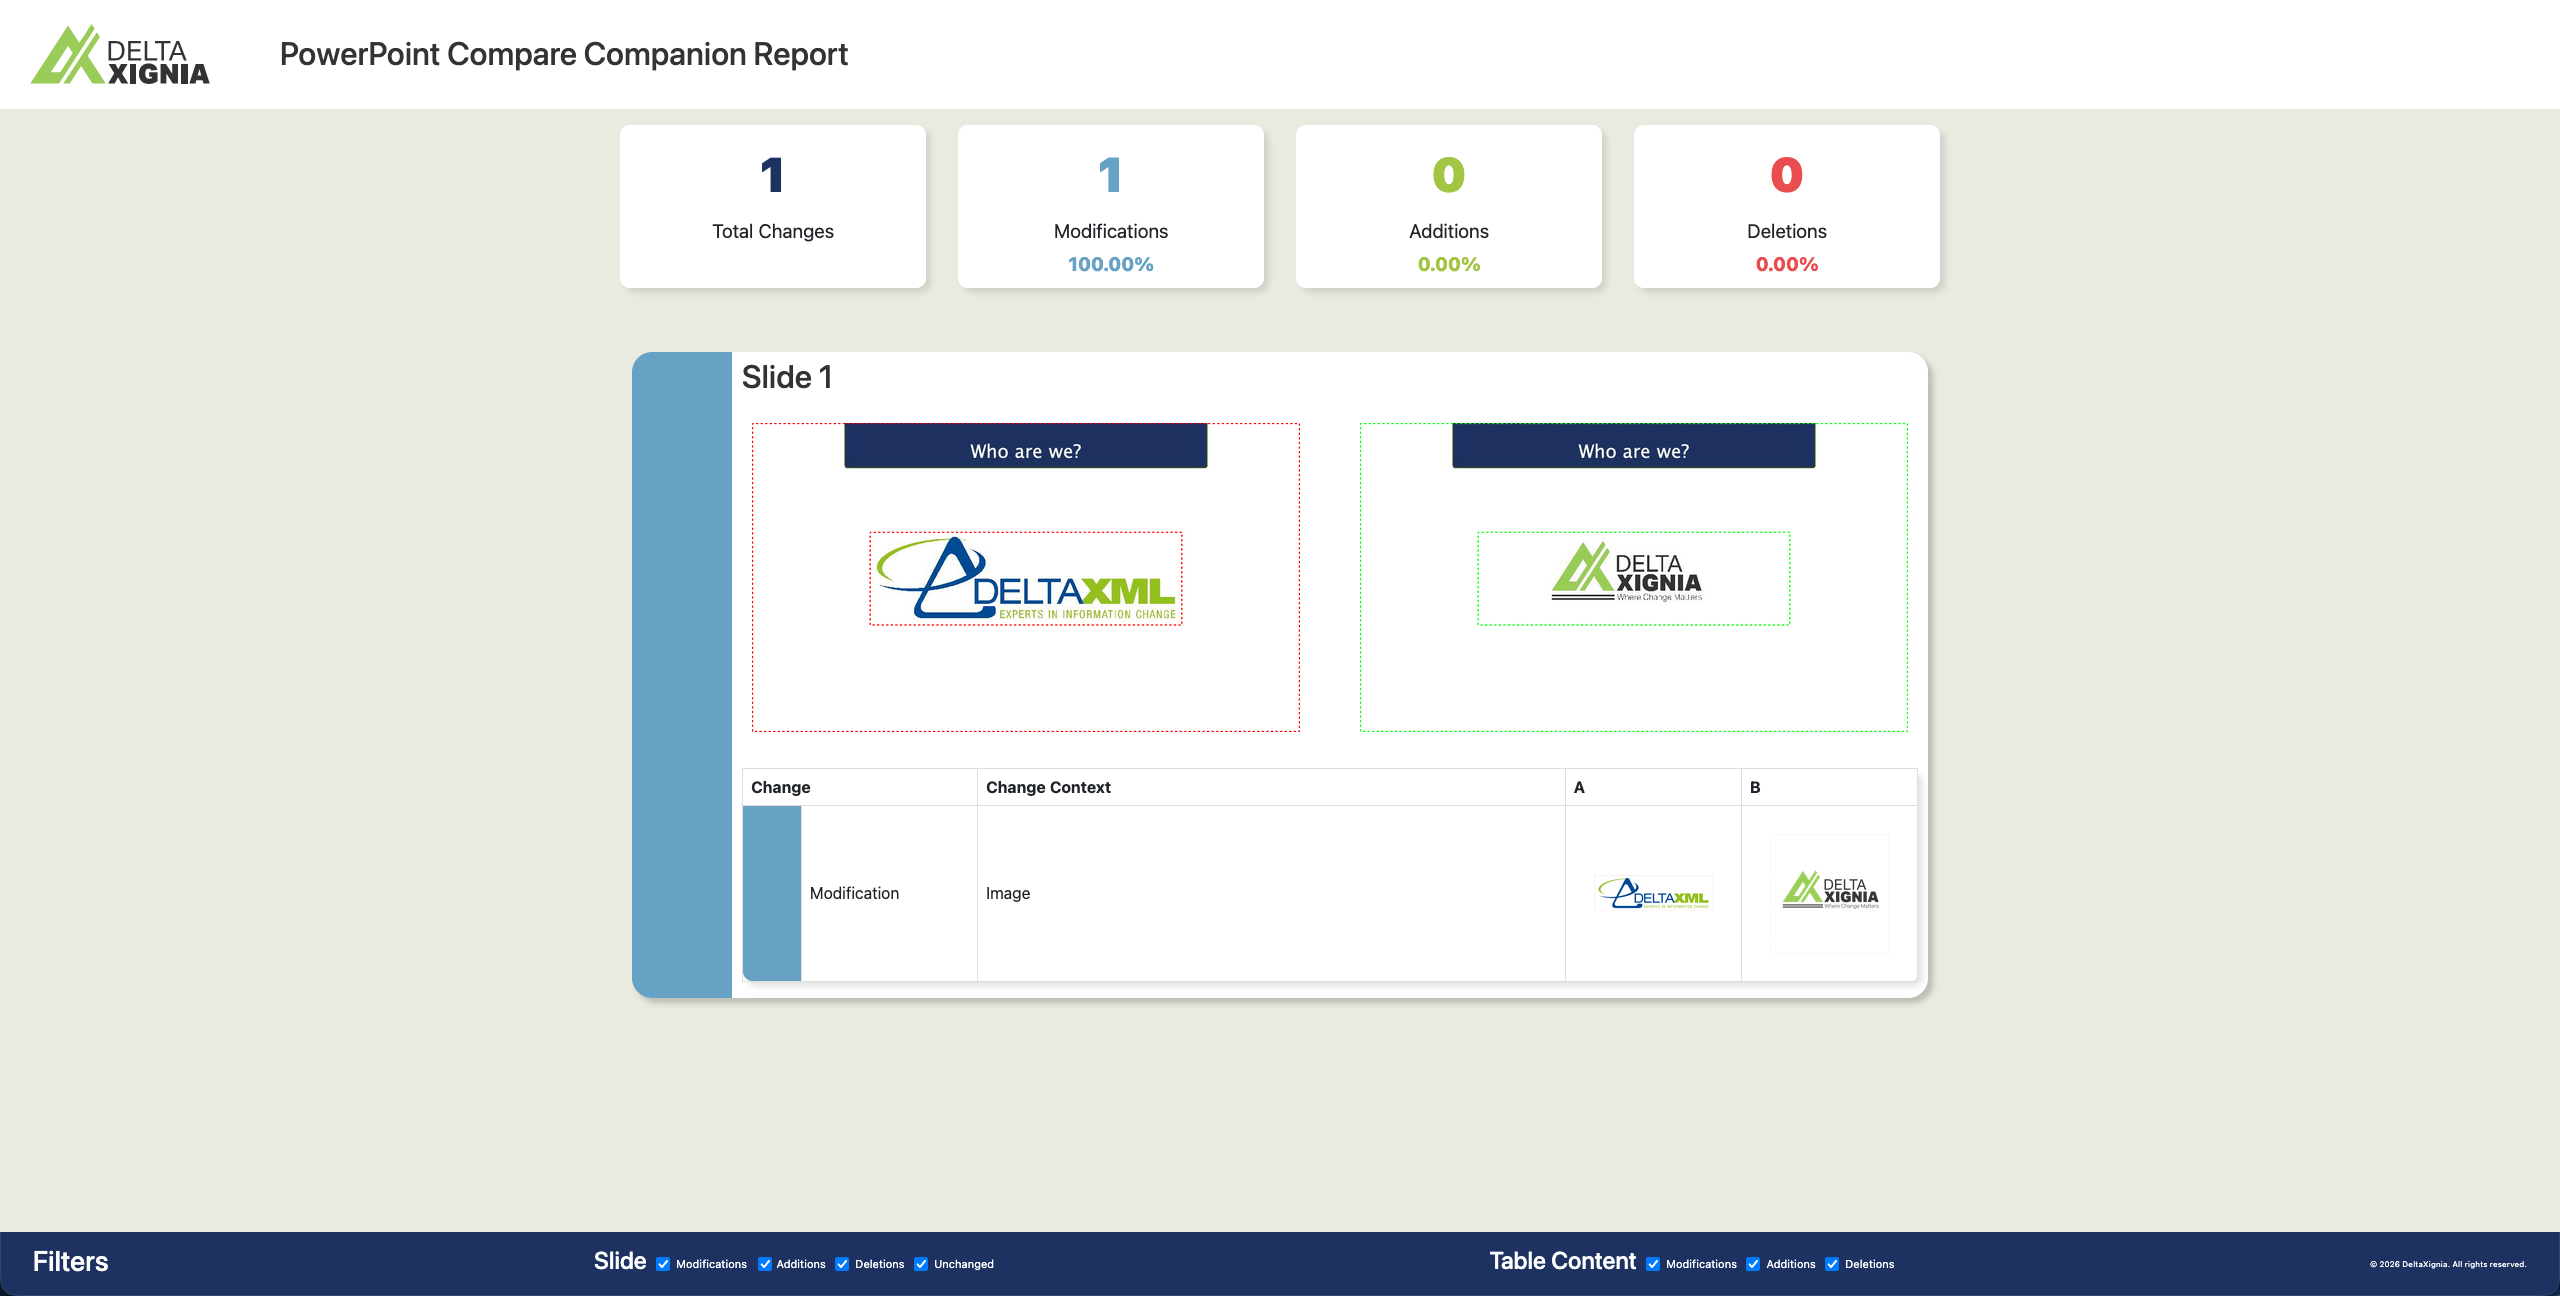
The two inputs show slides with Images that have been modified.


Image modifications are represented with comments in the PowerPoint result, and in the report the relevant row in the table shows a A and B versions of Binary Image Compared images which highlight the image differences with bounding boxes.

Slide Level Changes
Slide Addition
These two inputs show an added second slide to the B Input.
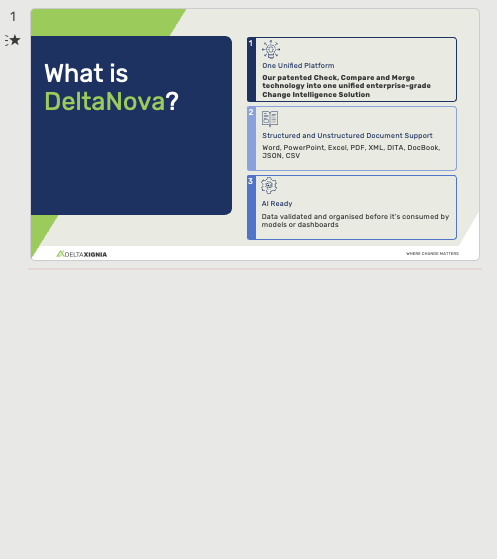
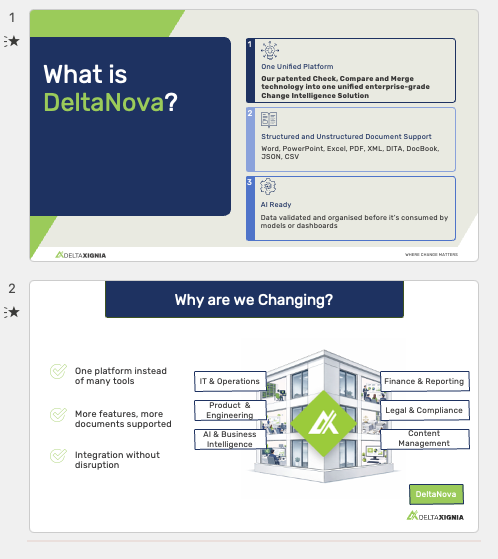
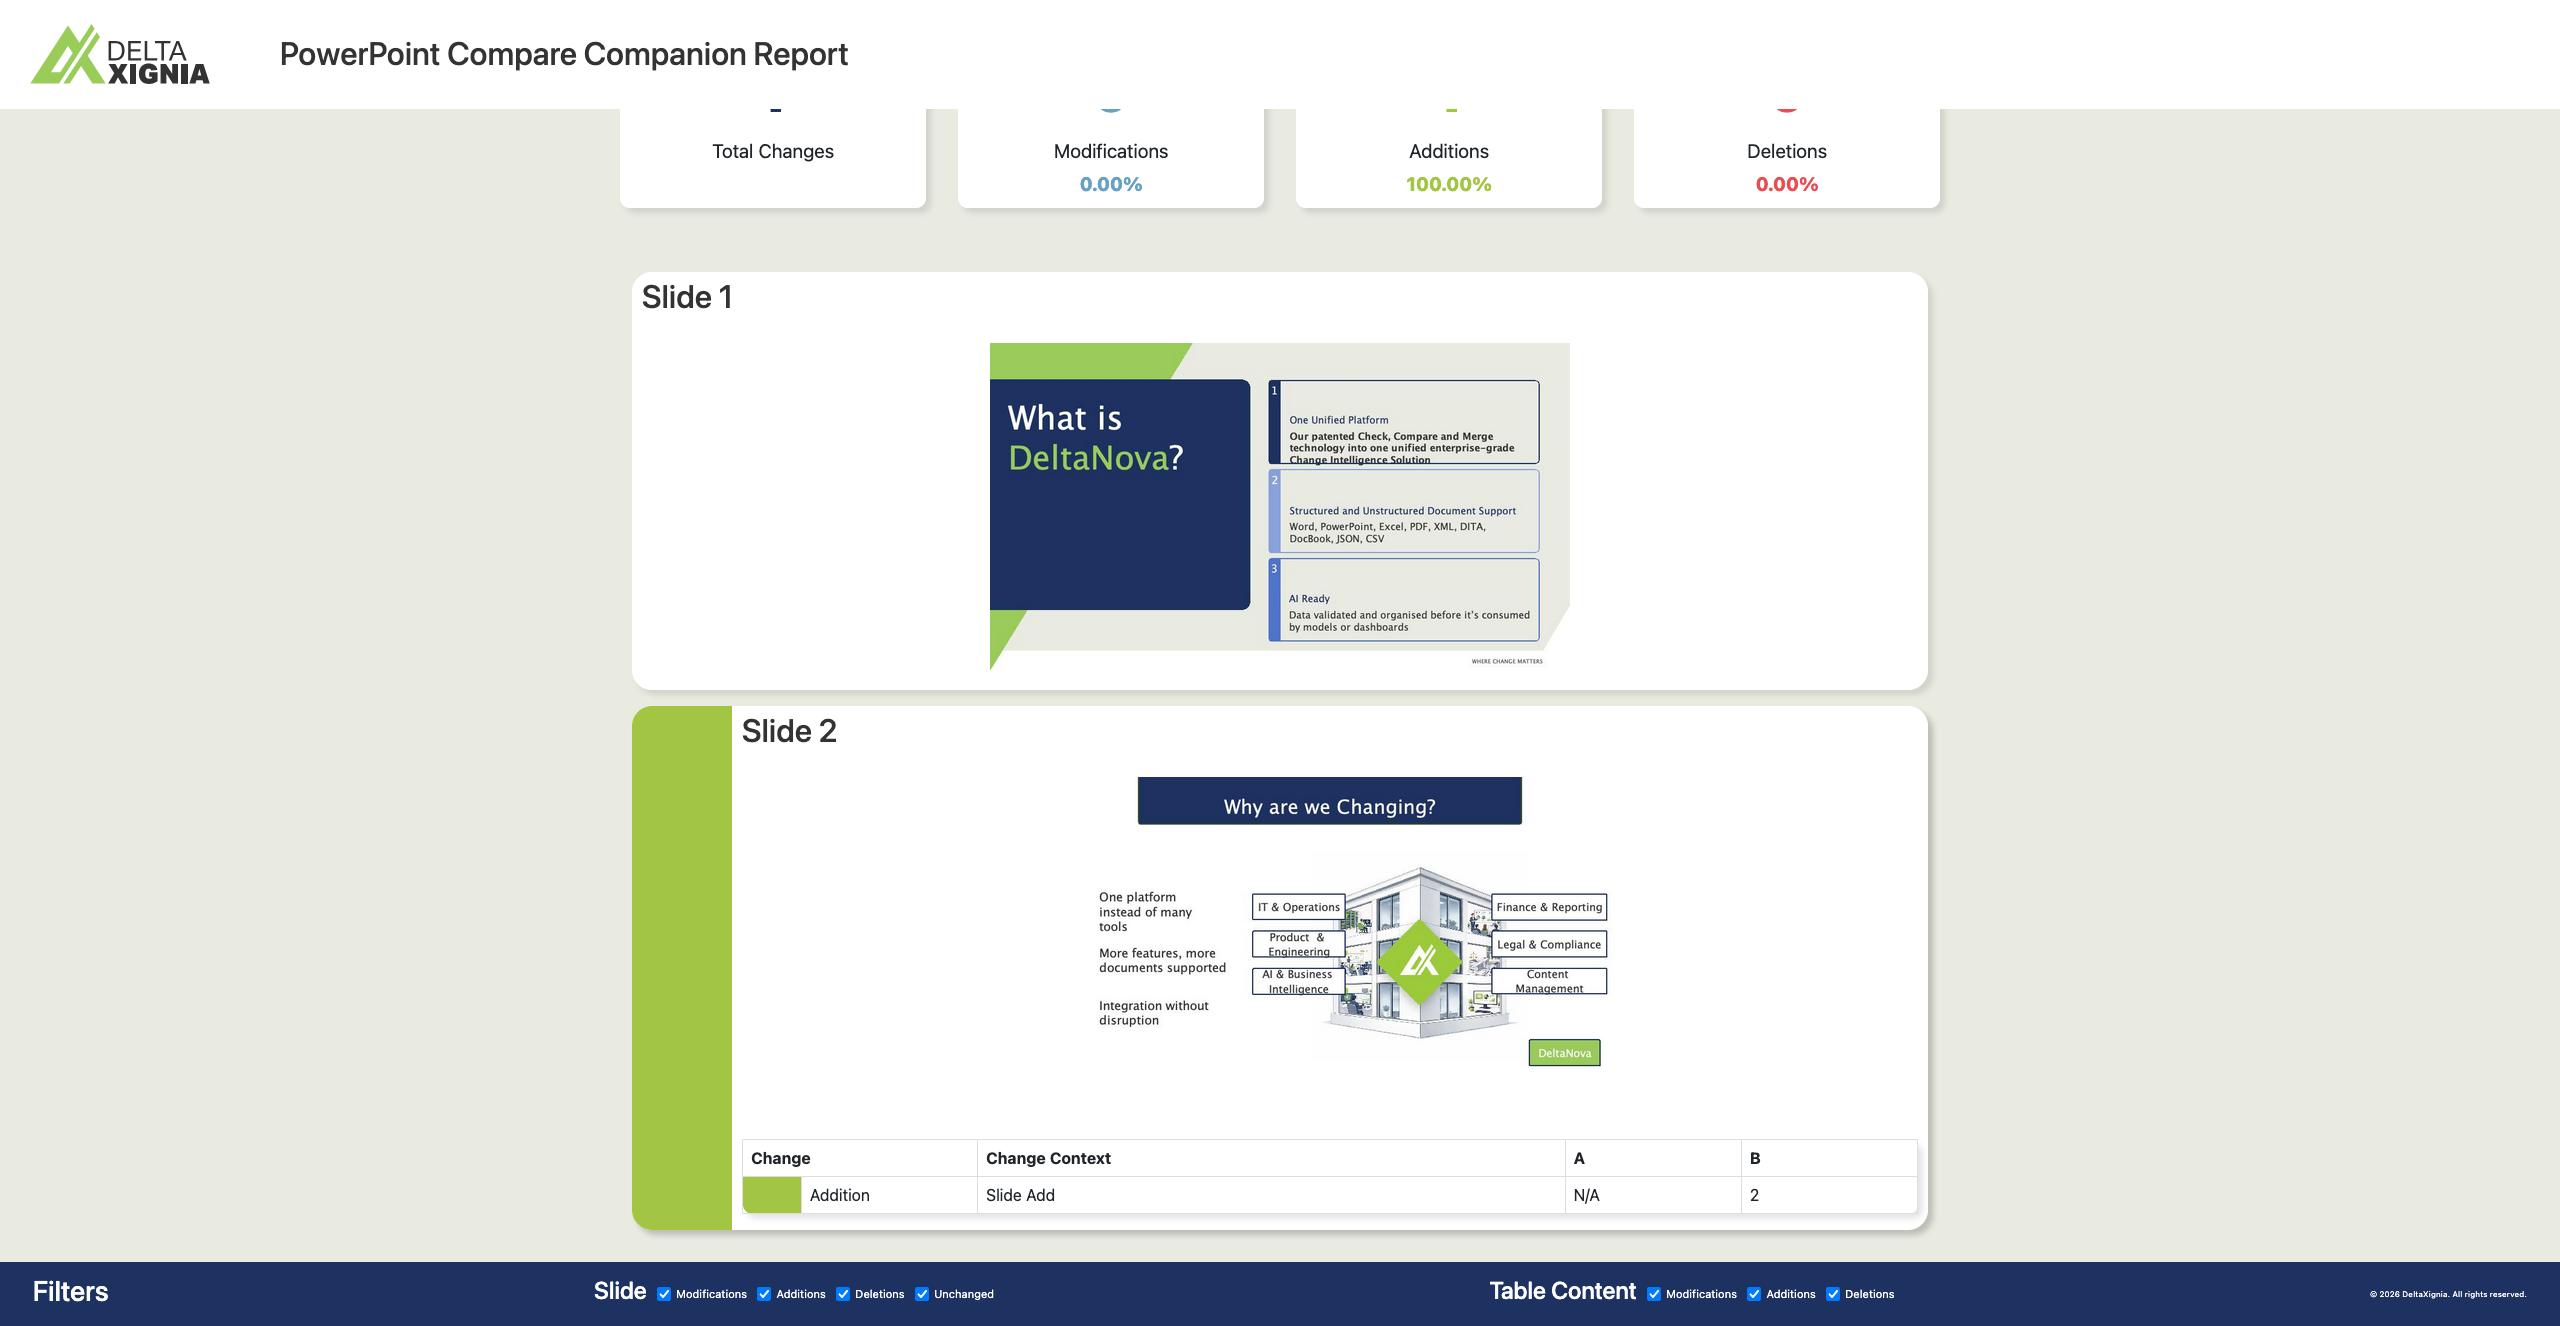
The result represents the slide addition with a comment attached to the slides stating its addition, and in the report through a green border, and the relevant Slide Added comment.

Slide Deletion
These two inputs have the second slide deleted leaving a single slide in the B input.

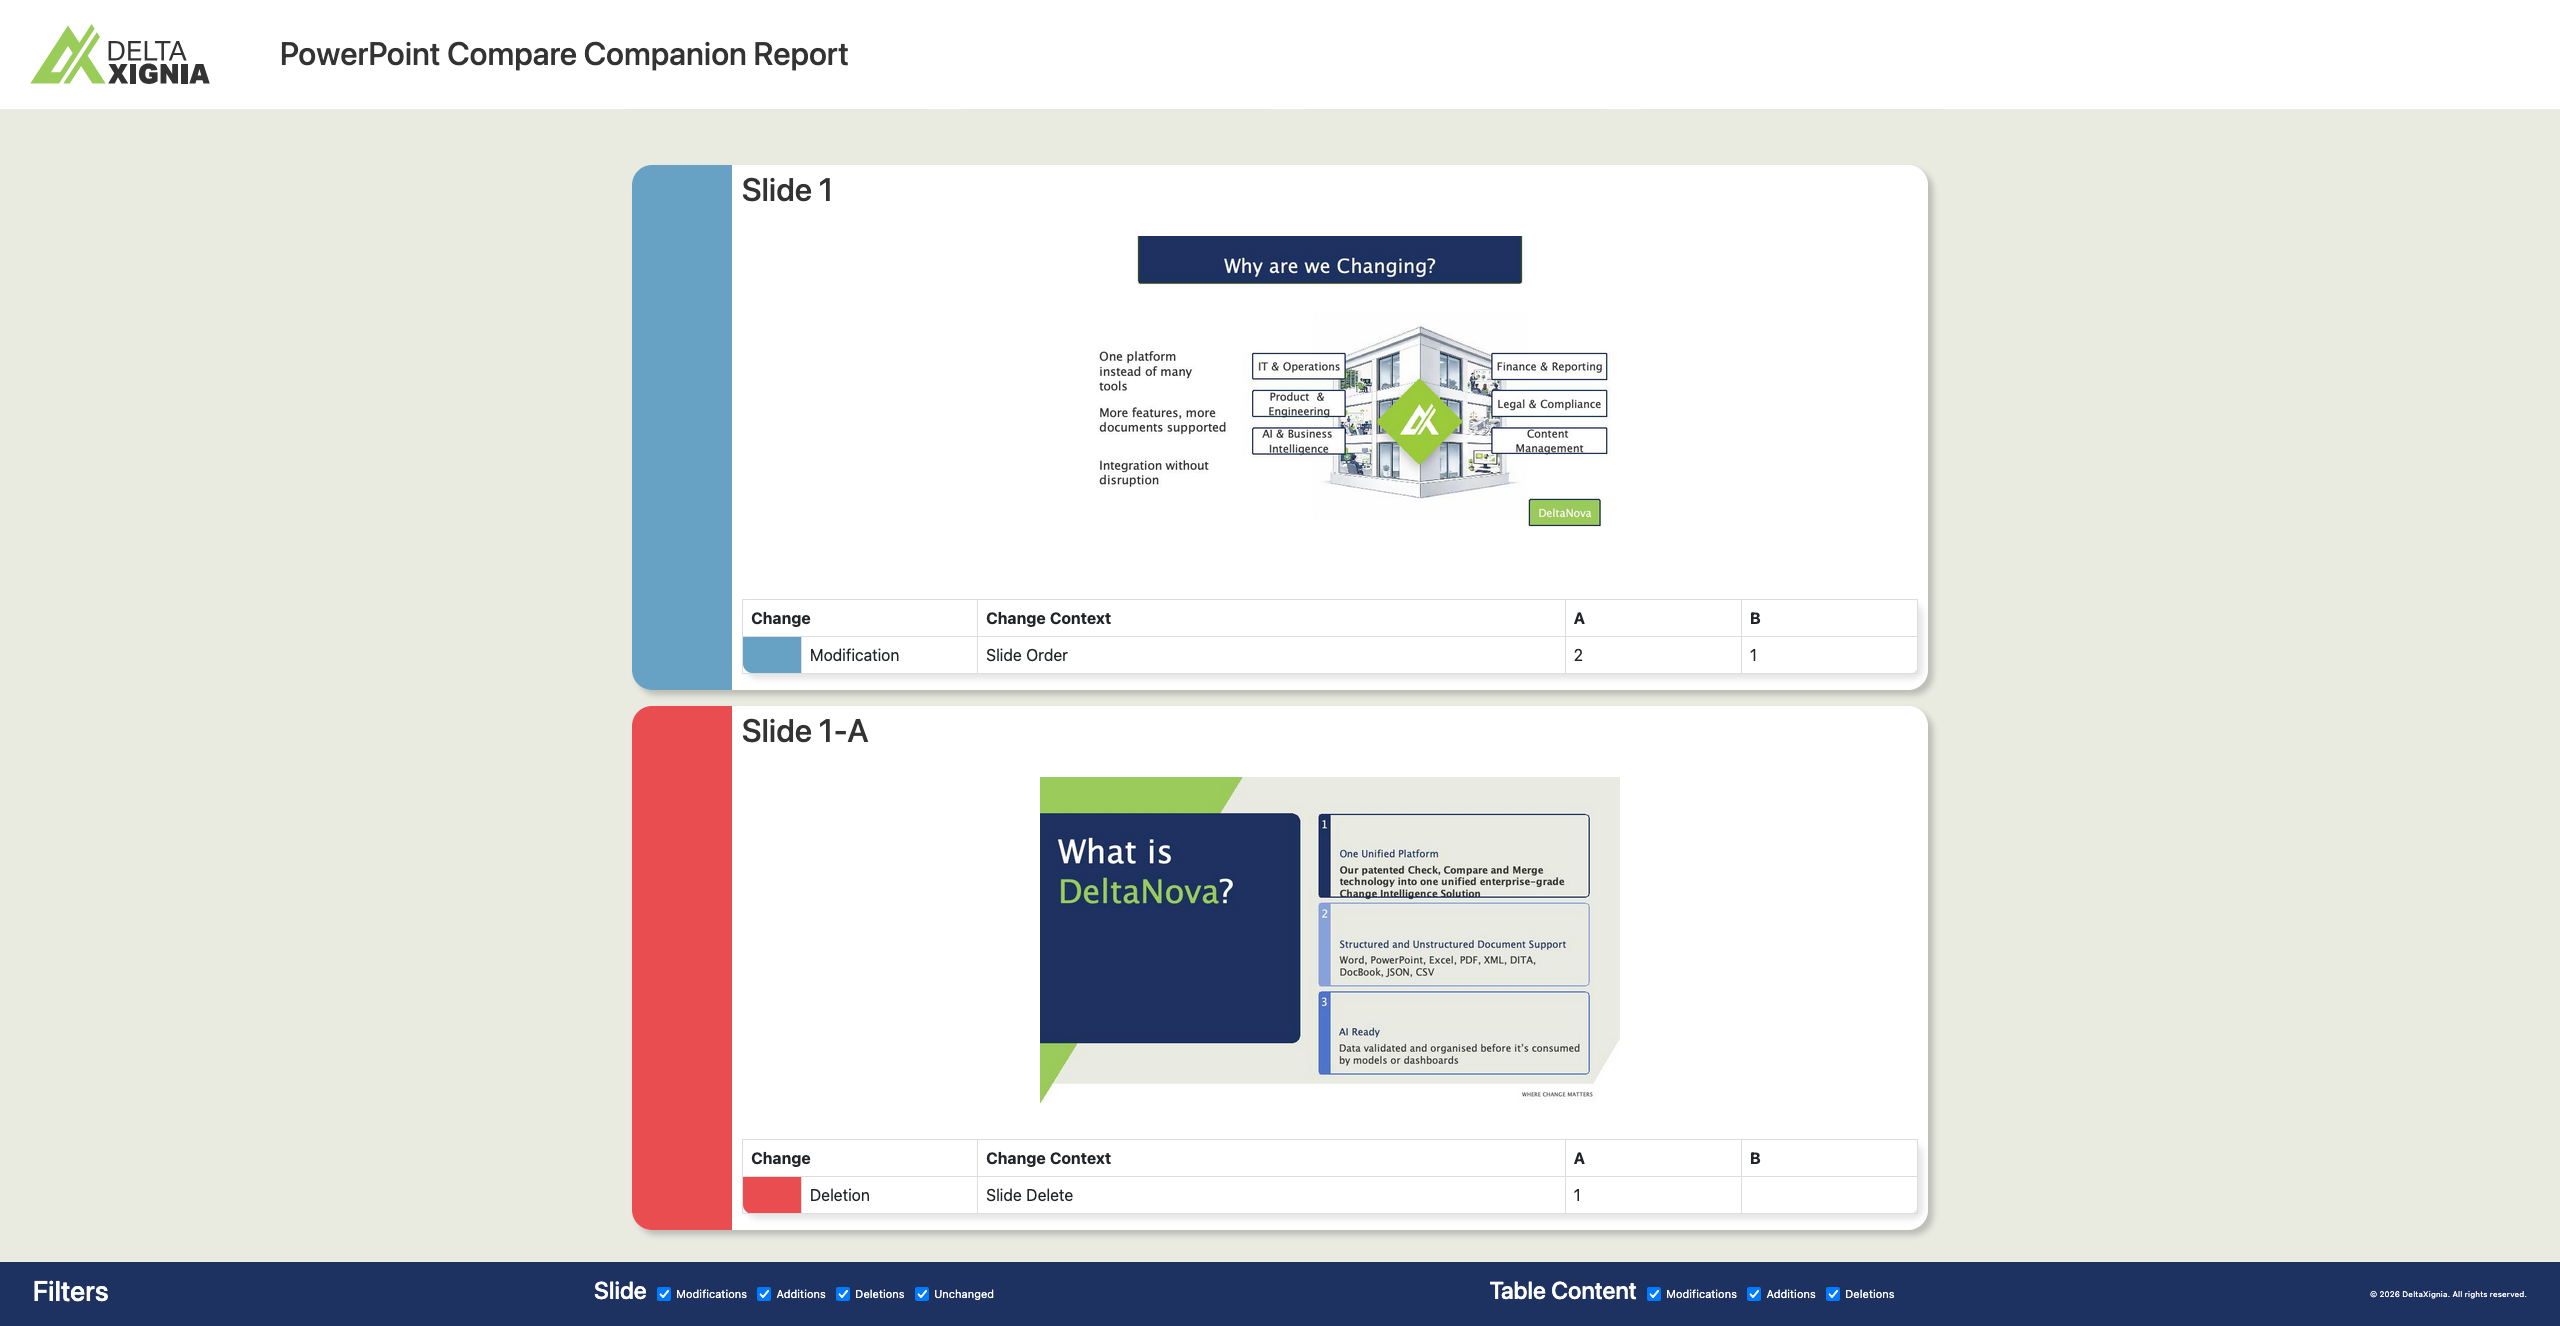
The result represents the deleted slide through a comment attached to the closest slides stating the position of the deleted slide, and in the report through labelling of the slide with a '-A' suffix, a red border, and the relevant Slide Delete comment. Other slides which have moved because of a deletion are also marked up with a Slide Order Modification comment.

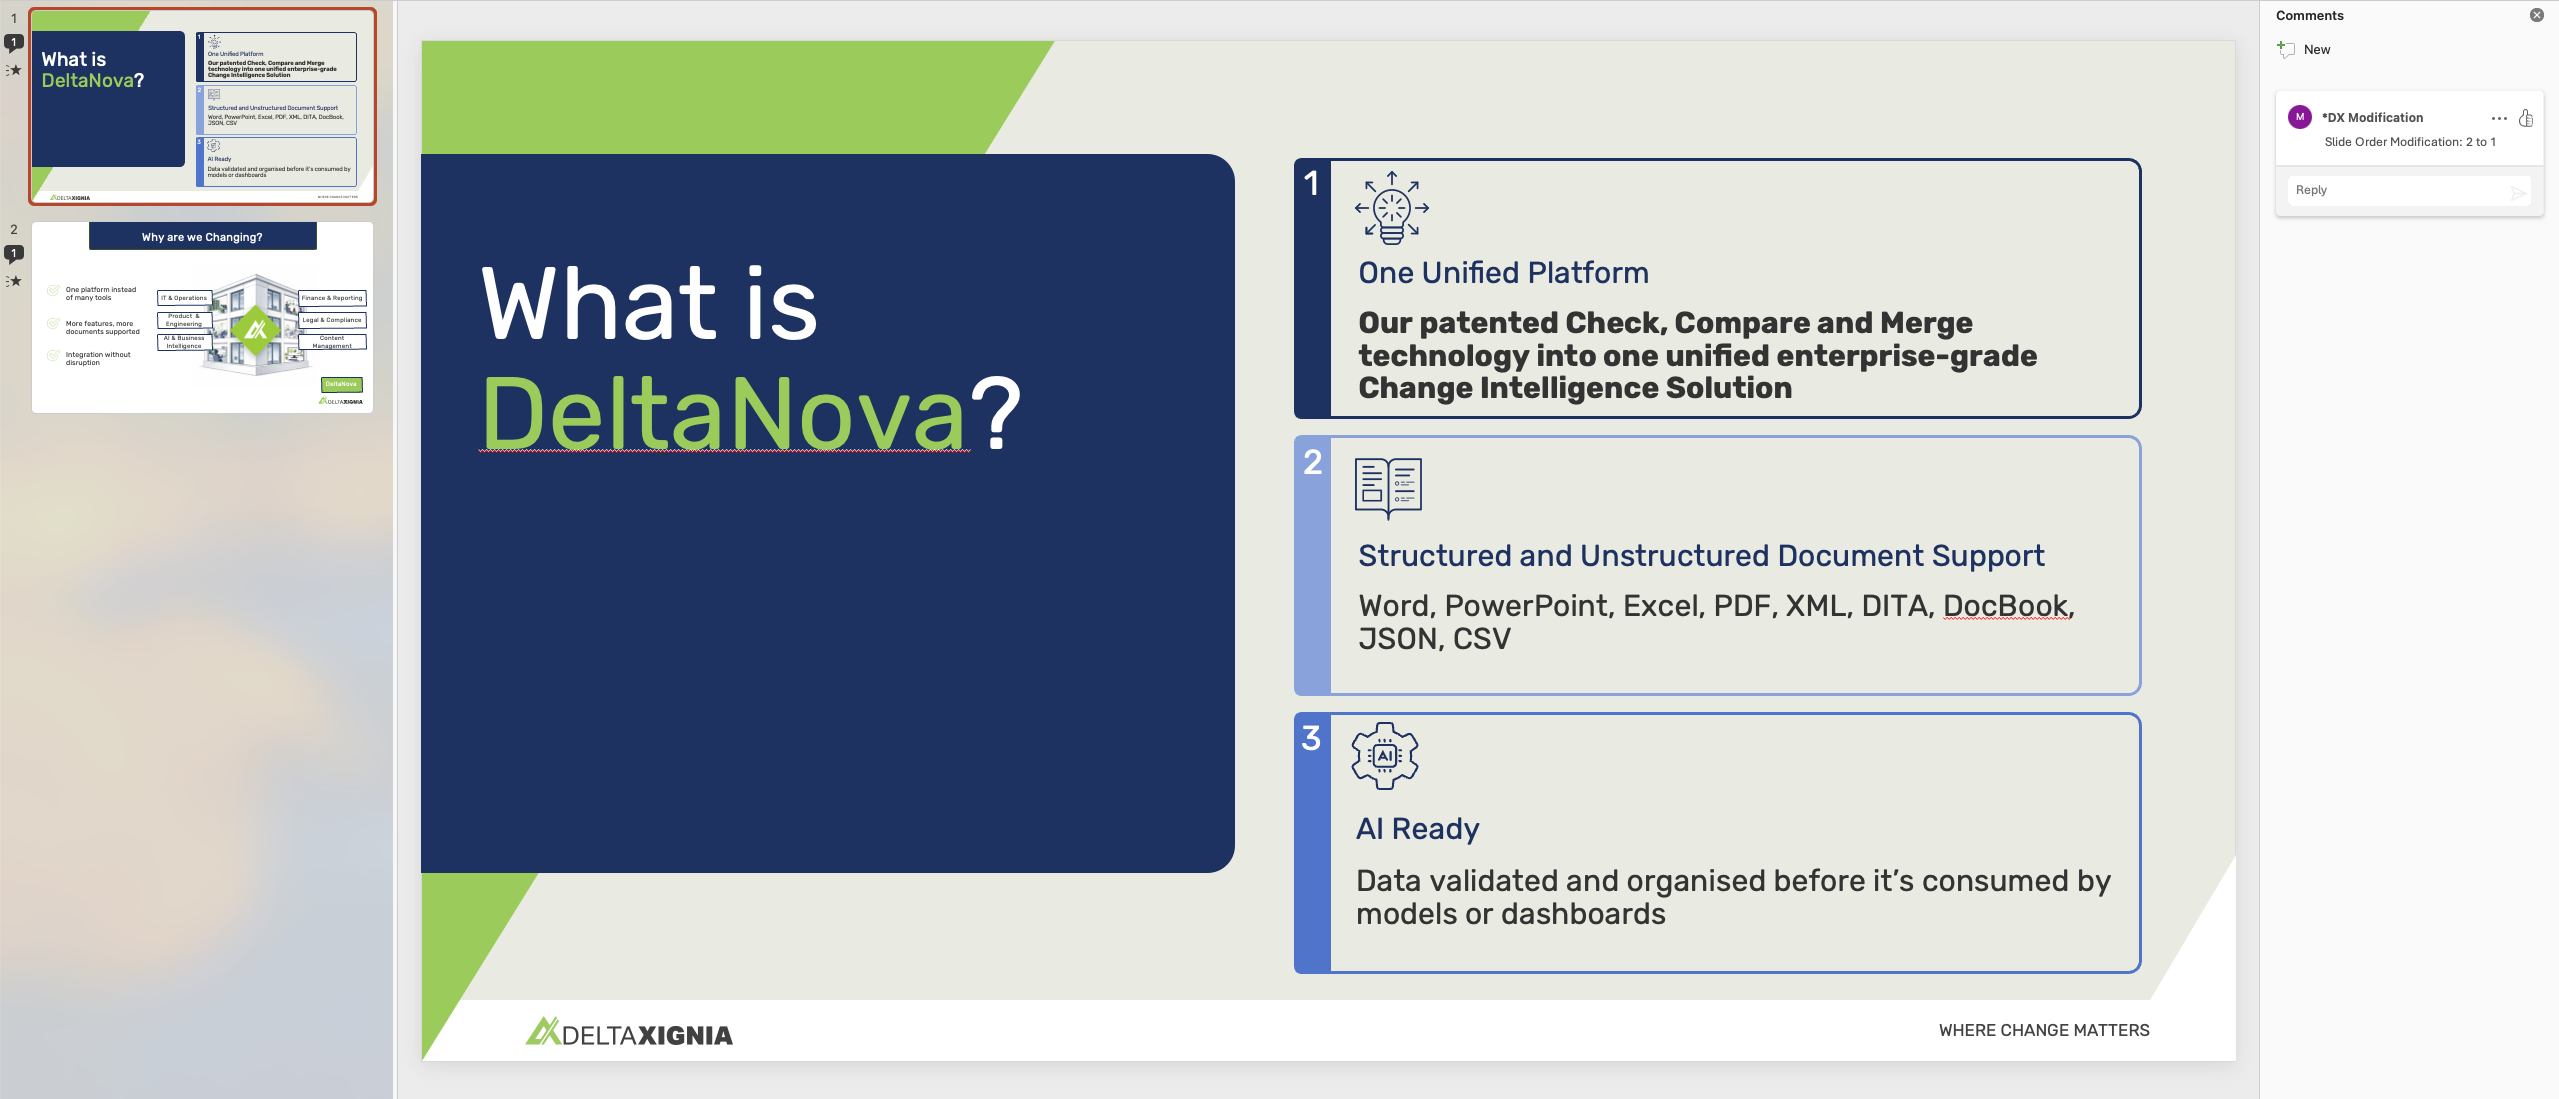
Slide Modification
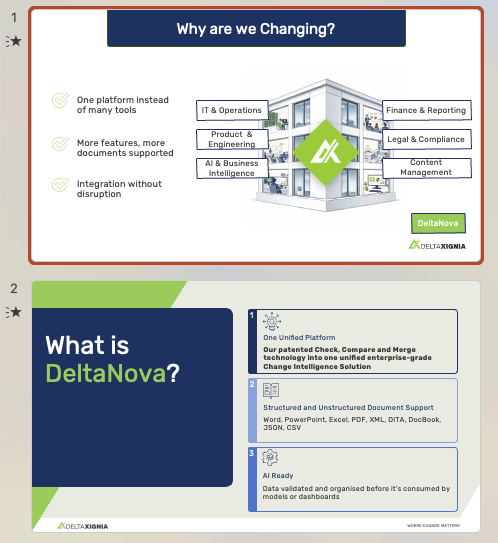
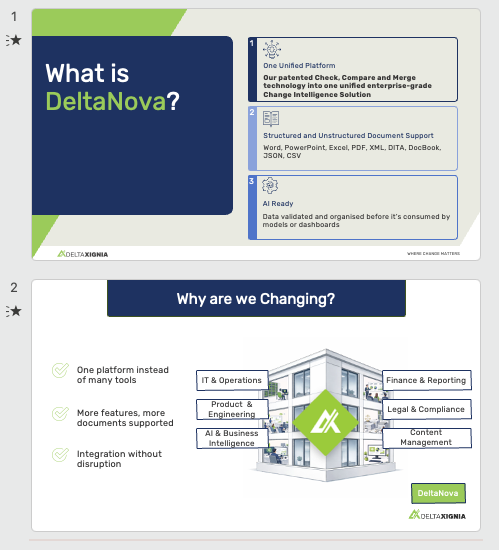
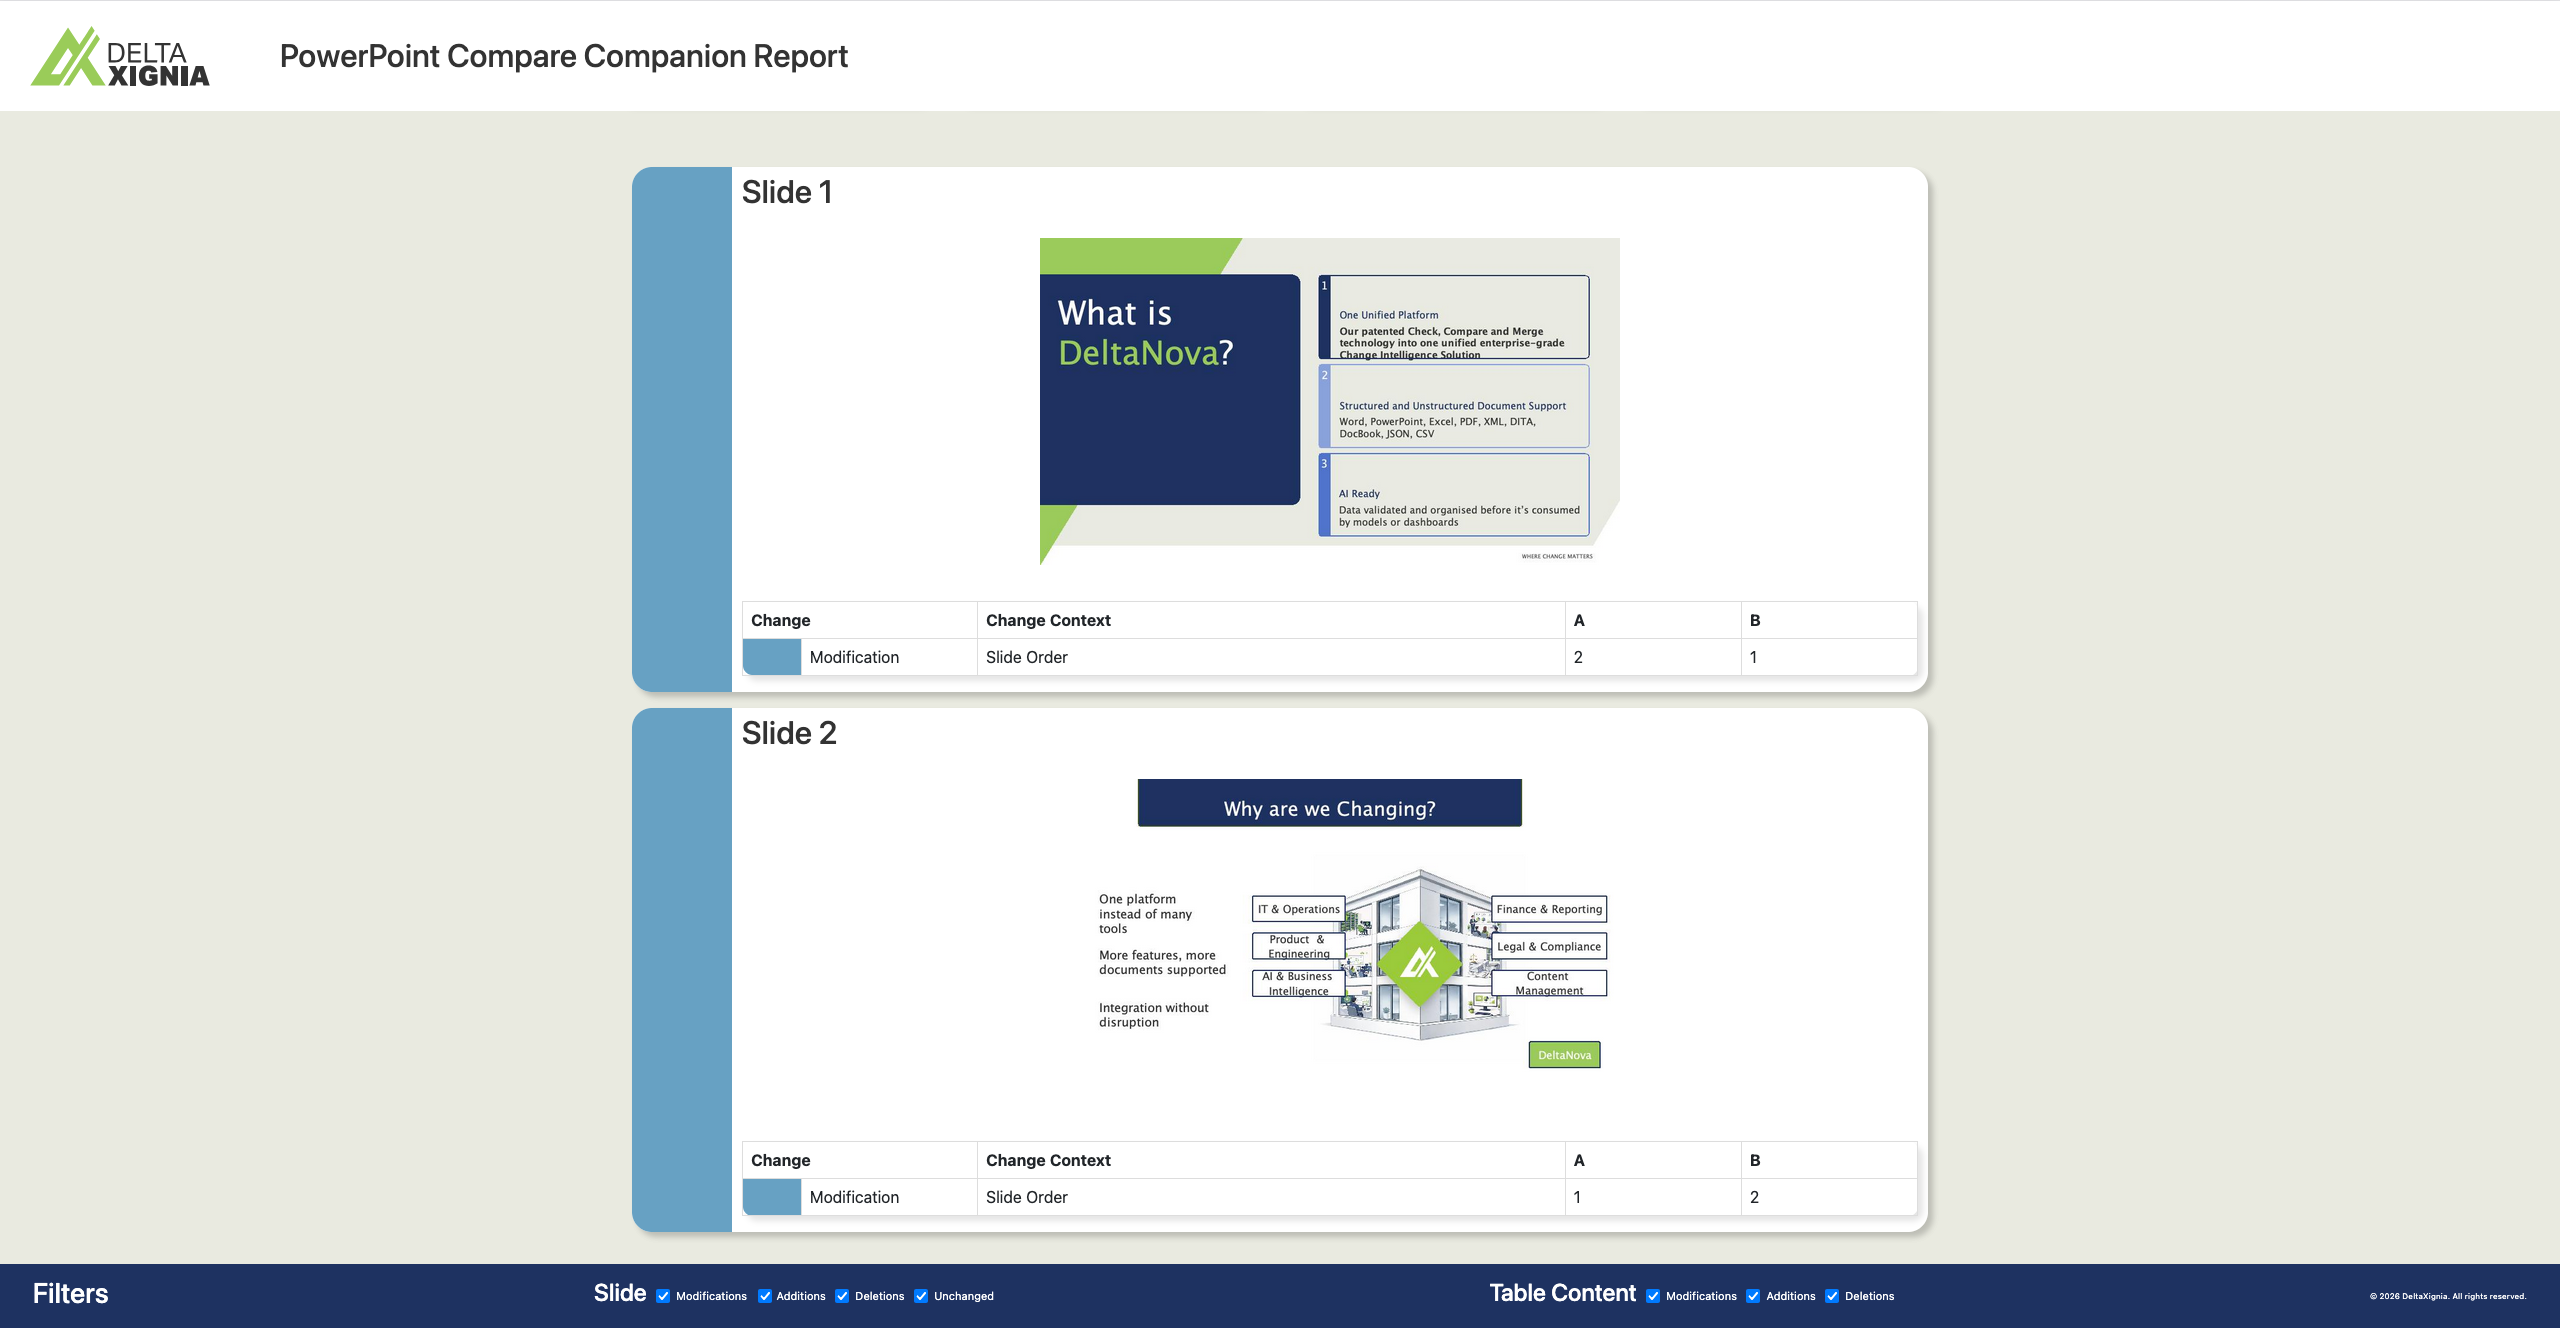
The modified slides are represented in the result with relevant comments stating a Slide Order Modification and the old and new positions. In the report the change is shown through the blue modification border and comment in the table stating the slide order change.